client log-in
LNG Update: Coronavirus Force Majeure — Context, Data, and Exposure
Corona-Related Force Majeure: Highlights From Our Recent LNG Update
- Chinese LNG Contractual Exposure – SPA Breakdown By Counterparty Pages 2, 5-9
- Historical Context – SARS, 6 Previous Global Health Emergencies Page 2
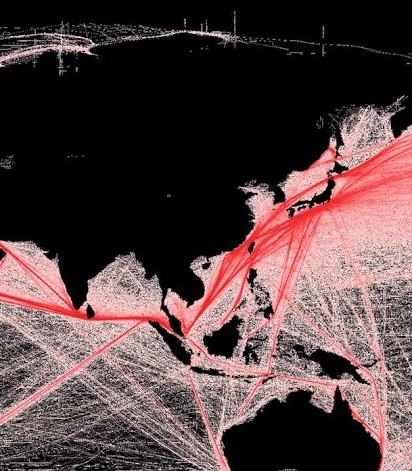
- NT Flash Points – 16 LNG Carriers Set To Call In China, Details Page 3
- Logistical Headwinds – Trucked LNG Data, Breakdown Pages 4-5
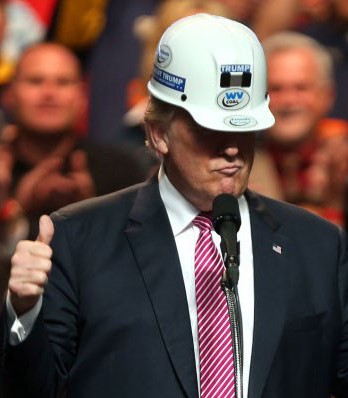
- Force Majeure Language – Cheniere (LNG) Pages 10-12
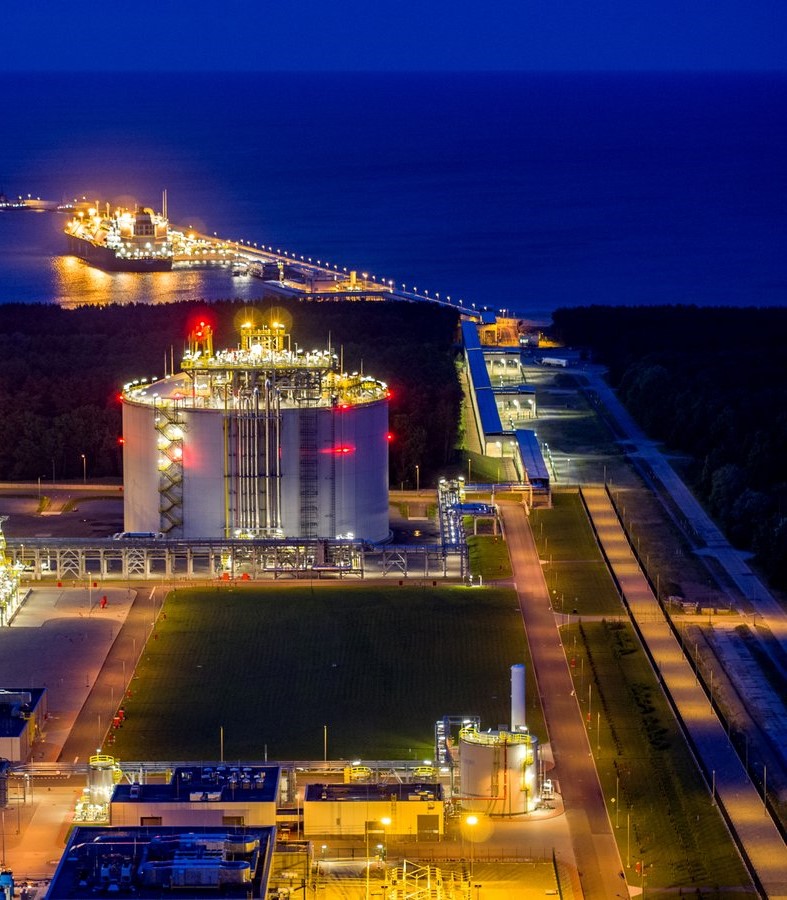
Coronavirus Puts Force Majeure In Play For Chinese Contracts: After days of speculation that Chinese LNG importers (CNOOC, Sinopec, CNPC) were considering invoking contractual force majeure clauses in their LNG contracts, CNOOC (China’s largest LNG importer – Figure 1) announced it had issued force majeure notices to their suppliers due to fallout from the coronavirus (nCoV). Total has reportedly rejected CNOOC’s notice of force majeure, setting up what we expect to be a continued string of notices and conflicting rhetoric, as the relatively opaque process plays out in a weakened and nervous LNG market, and amid the Q419 earnings cycle. While the ultimate impact of these contractual disputes is unclear – ranging from timeline delays (EPC), non-payment, and beyond — what does seem clear is that the issue should continue to build. As noted in Figure 3 – there are 16 LNG vessels scheduled to discharge in China over the next 5 business days, and we’d expect additional contractual flash points ahead.
Validity To Be Determined. We hope to get more clarity on the validity of force majeure claims in the coming days — particularly as they pertain to DES (fixed destination) and FOB cargos (flexible destinations — like Cheniere’s) which can be diverted to unaffected markets. We would think it’s less likely Cheniere’s FOB cargoes would be impacted by force majeure issues at the geographical origin of the original purchaser, given their inherent flexibility.
More Than Just A Demand Headwind In China. It’s also worth noting that Corona issues go beyond simply demand destruction within the Chinese market. Given pipeline infrastructure limitations in China, significant volumes of LNG are trucked to end users (Figures 4 & 5), which also brings logistical issues to the forefront, as there’s likely a similar lag in LNG truck drivers returning to work as those in factories and mills following the Lunar New Year holiday and quarantine efforts by the Chinese government. The risks also expand beyond volume-based LNG contracts, with shipyards, hard-asset delay schedules and tangential energy infrastructure also potentially impacted. Late yesterday gas producer Energean noted TechnipFMC had claimed corona-related force majeure on a FPSO meant for an Israeli offshore project
For access information, email us at [email protected]
Read More