equities Archives - Webber Research
banner

Webber Research: Hydrogen Tracker Highlights:

  • Recent Highlights                                                   (page 1)
  • LH2 Carrier Progress                                             (page 3)
  • M&A Tracker                                                          (page 4)
  • Valuation Summaries                                             (page 5)
  • Hydrogen Production Costs From Fossil Fuels     (page 6)
  • Hydrogen Production Costs From Renewables    (page 7)
  • Hydrogen Projects & Electrolyzer Tech                 (page 8)
  • Fuel Cell Technology Comparisons                      (page 9)

    Recent Highlights
    NKLA Breaks Ground On Coolidge Facility: On 7/23 NKLA announced it began construction on its 1MM sqft…… 
    NEE Eases Into Hydrogen: On 7/24 NEE proposed a $65MM pilot green hydrogen plant with a 20MW electrolyzer in Florida…. 
    MSFT To Replace Diesel Backup Power With Hydrogen: On 7/27 MSFT announced it successfully powered a row of data center servers for 48 consecutive hours with a 150kw hydrogen fuel cell system….
    Linde To Build Refueling Station For World’s First Hydrogen Passenger Train: LIN will build and operate the station and is expected to begin construction in…                                                                            BKR & Snam Complete Testing On Hybrid Hydrogen Turbine: On 7/20 BKR and Snam announced the successful testing of the hybrid hydrogen-powered NovaLT12 turbine 


Read More

Exxon, Qatar & Golden Pass: Something’s Gotta Give

Analyzing Project Costs & Logistics In The COVID Era
(Part 1 of 2 – Satellite Image Analysis Later This Week)

  • Golden Pass: 4 Key Takeaways……………………………………Page 2
  • EPC: Monthly Progress Evolution……………………………….. Page 3
  • April 2020 Project Update…………………………………………Page 4
    • IP & Construction Activity ……………………………………Page 5
    • Labor Logistics In The COVID Era ………………………….Page 6
    • Cost Analysis – Significant Overruns Already?……………Page 8
    • COVID-19 Impact …………………………………………….Page 9
  • December 2019 Baseline
    • Partner Organization, Key Participants ……………………Page 10
    • EPC Roles: MDR, Zachry, Chiyoda …………………………Page 12
    • Variance Analysis …………………………………………….Page 14

For access information, please email us at [email protected]

Key Takeaways:

1) What’s Eating Golden Pass? QP & XOM Get Squirrelly In Press. On April 6th, the NYT ran an exclusive quoting Saad al-Kaabi (former QP CEO & current Qatar Energy Minister) as saying Golden Pass (GPX) was proceeding and on schedule. However, that was quickly followed by QP’s 30% partner Exxon (XOM) cutting $11B of 2020 CAPEX, delaying FID for Rovuma LNG (Mozambique), reiterating Coral LNG’s development, while ignoring GPX altogether. Since then, the NYT took down the article, energy markets are upside down, & questions mount. Based on actual EPC progress, we believe the reaffirmed GPX schedule falls somewhere between…..continued (Pages 2-3)
2) Is Golden Pass In Trouble? Monthly Progress Analysis. We believe GPX’s engineering has remained well behind schedule. Data suggests GPX has been attempting (unsuccessfully) to ramp labor earlier than planned…continued (Pages 9 & 13-14)
3) Labor Logistics In The COVID Era…On 4/17/20, GPX requested additional on-site parking amid challenges with safely busing craft workers to the site amid a global pandemic, however busing craft workers wasn’t supposed to begin for another year (2021). This minor, intuitive disclosure actually offers a few significant read-throughs for the project, as well as its path moving forward…continued (Pages 6-8)
4) Cost Overruns Poised To Accelerate From Here? Over the next 6 months we believe the project is already looking at construction cost overruns (relative to its baseline schedule) of at least…continued (Page 7)


Click here to buy this report

Read More

W|EPC: Sempra’s Costa Azul – Is ECA Different? A Deep Dive Into SRE’s Mighty Mouse

Sempra LNG’s Costa Azul – Analysis & Risks As Larger Projects Falter

  • Overview                                                                            Pages 1-3
  • ECA Phase 1 & 2 Structures                                            Pages 3-4
  • Supply Dynamics & Feedstock Analysis                       Pages 6-7
  • Sempra LNG Commercial Arrangements                    Pages 8-9
  • EPC Analysis
    • Project History & Dynamics                                    Pages 9-10
    • TechnipFMC – Historical Execution Details         Pages 10-12
    • Site Issues With Modularization                            Pages 12-13
    • Independent Site & Schedule Analysis                Pages 13-17
    • Project Cost Analysis & Major Risks                      Pages 18-26
  • Shipping, Midstream                                                        Pages 27-28
  • Management Questions                                                  Pages 29-30
  • Conclusions                                                                        Pages 30-31

Mighty Mouse? Sempra’s (SRE) Costa Azul LNG (ECA, 2.4mtpa Phase-1) might be the only North American LNG project with a realistic chance at FID in 2020. As we saw last cycle, being small (and cheap) can be an advantage in difficult markets. As we note below, we’ve included our key takeaways around 1) Project viability in the current environment, 2) Site & Permitting Issues, 3) our independent project timeline & cost estimates, and 4) our Independent assessment of ECA’s project economics. 

Background: Energía Costa Azul (ECA) is a 1 BCF/d LNG import terminal located north of Ensenada, Baja California, Mexico, ~31 miles south of the U.S./Mexican border (San Diego-Tijuana). It’s owned by Infrastructura Energetic Nova (IEnova), one of the largest natural gas infrastructure developers in Mexico, and is listed on the Mexican Stock Exchange (BMV: IENOVA). Sempra Energy owns 66.43% of IEnova.
Existing Infrastructure: The current ECA import terminal (Figure 1) includes the following infrastructure: (1) a marine berth and breakwater; (2) two 160,000 m3 LNG tanks; and (3) LNG vaporizers, nitrogen injection systems, and pipeline interconnections. Similar to some existing U.S. exporters and brownfield projects, ECA will be turning their facilities around to export LNG.

Permitting: ECA has received most of the major Mexico and U.S. permits needed to begin construction, but still lacks a key Mexican land-use permit. ECA LNG is not subject to FERC review under the National Gas Act (NGA) or National Environmental Policy Agency (NEPA). However, ECA is subject to various Mexican state and federal regulatory agencies, such as the Secretaris de Medio Ambiente y Recursos Naturales/ Ministry of Environmental and Natural Resources (SEMARNAT) and the Agencia Nacional de Seguridad Industrial y de Proteccion al Medio Ambiente del Sector Hidrocarburos/ National Agency for Industrial Security and Environmental Protection for the Hydrocarbon Industry (ASEA), as well as the U.S. Department of Energy (DOE).…continued
Click here to buy this report

Read More

Tankers Reset As OPEC War Changes Economics

  • Market Updates & Thoughts………………..Pages 1-3
  • Tanker Trade Dynamics………………………Page 4
  • Fuel Spreads, Economics……………………Page 5
  • Crude/Product/LPG Rate Changes…………Pages 6-9
  • LNG Arb, Freight Dynamics…………………Pages 10-11
  • Container Fundamentals……………………Page 12
  • Relative Valuations…………………………..Pages 13-19

Tanker Spot Rates Soften Off Of Peak Levels As Saudi Reign In Freight Rebates: Spot rates weakened on slow fixture activity, crude prices bounding from under $25/barrel to ~$30/barrel (Brent), and Saudi Arabia announced limiting freight compensation to 10% of crude’s official selling price. According to TradeWinds, at least 10 VLCC & Suezmax spot fixtures loading Saudi crude had failed last week. VLCC spot rates (TCEs) led the decline with rates falling to $135.3K/day (-52% w/w and +408% m/m), Suezmax TCEs at $70.0K/day (-42% w/w and +166% m/m), and Aframax TCEs firming to $59.5K/day (+39% w/w and +120% m/m). We note rates remain well above consensus.

Roughly Half Of Bahri’s VLCC On Subject Destined For USG: Last week, Saudi Arabia’s Bahri put 25 VLCCs on subject after their announcement to flood the oil market (by increasing its production and lowering its oil price) in response to OPEC+ disbandment (see our OPEC+ Fallout note). VLCC rates had spiked as Saudi Arabia was said to provide freight rebates to some customers for crude transports between Saudi Arabia and Egypt. Bahri owns 41 VLCCs and rarely enters the spot market to charter third party tonnage. In addition to the large number of subjects, the intended destination for these vessels are telling of Saudi’s intent: 10 of the 25 VLCCs are destinated for the U.S. Gulf, 4 are likely going to Europe, 10 are fixed to discharge at the entry point of the Sumed pipeline (Ain Sokhna) which transports crude oil through Egypt to the Mediterranean (likely to end up in Europe). None of the spot VLCCs are fixed to Eastern destinations.

Scrubber Payback Period Upended Following Crash In Crude Prices: The spread between HSFO and LSFO has narrowed to $87/mt in Singapore and $47/mt in Rotterdam (Figures 2 & 3), extending the payback period to ~4 years. A VLCC fitted with a scrubber is able to command a spot earnings premium of ~$4.5K/day, down from nearly $20K/day at the start of the year.

For access information please email us at [email protected]

Read More

OPEC+ Fallout: Contagion Everywhere From Looming Price War…

***From Sunday 3/8***

For access information please email us at [email protected]

Tankers Among Few Eventual Beneficiaries

  • Impact On Tankers:                                                                                     Page 1, 3-5
  • The 2015 Tanker Comp, Similarities, Implied Upside                         Pages 3-4
  • Impact On LNG Developers (LNG, TELL, NEXT, GLNG, NFE)            Pages 2-3
  • Historical & Implied Equity Correlations To Crude Vol                       Page 3
  • NAVs: Current, Mid-Cycle to Trough Range                                          Page 3
  • OPEC+ Background                                                                                   Page 3, 6

This Is Going To Hurt: On Friday (3/6) talks between OPEC and its OPEC+ allies (Russia) over a corona-related production cut collapsed, sending oil prices down with it (Brent and WTI down 9% and 10%, respectively on Friday). While the lack of OPEC+ support for crude prices was enough to rattle markets, what’s transpired since – the relationship between the Saudis and the Russians rapidly devolving into what looks like an all-out pricing war – has the potential to reshape energy markets for years to come, and will likely take the mantle as the most value-destructive policy shift in decades.

Exogenous Demand Shock, Meet Exogenous Supply Shock. As noted below, Aramco has already come out with discounted crude prices (OSPs) on the back of the meeting, and is reportedly speaking to a potential production ramp from its current 9.7mbd, to well above 10mbd, and could even reach a record of 12mbd. Again – that would be additional supply into a market that’s already oversupplied amid global efforts to contain the Coronavirus (nCoV) weighing on demand. While the Russians have less available swing production, what they do have will be moving in the wrong direction as well, as they look to grab share from U.S. Shale producers.

How Does This Impact Our Universe:
Tankers: We’ll Call It Mixed… (And That’s One Of The Few Bright Spots). Once the dust settles the tanker group, including FRO, DHT, EURN, ASC, etc, should be one of the few actual overproduction beneficiaries as: 1) tanker activity and rates are generally positively levered to production volumes (including overproduction), and 2) we expect to see floating storage, both economic (as the front end of the crude forward curve collapses (already in progress) and…….continued on Pages 3-5

Most Relevant Tanker Comp: 2015, after OPEC failed to respond to falling crude prices. While overcapacity and falling crude prices ravaged the rest of the energy markets, Crude Tanker rates (VLCCs) averaged $65K/day (Figure 4) – a level not reached since 2008, up 116% y/y and the firmest level in nearly a decade. What would 2015 day rates mean for current tanker stocks? If we replaced our current 2020 rate decks with the 2015 average rates….continued on page Pages 2-3

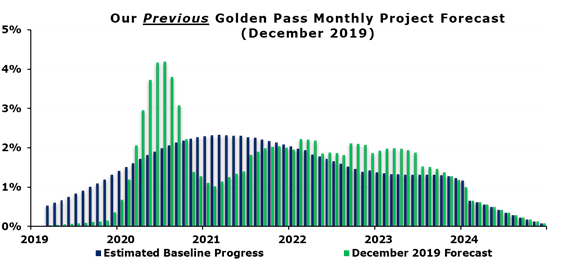
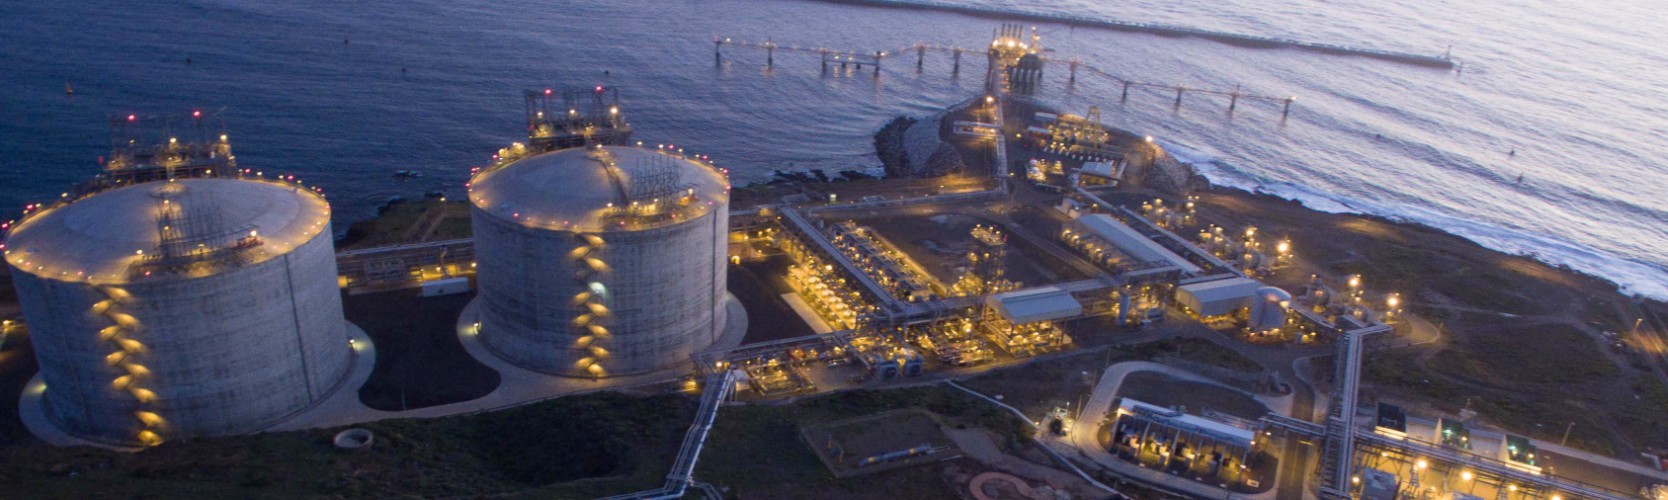
Everything Stops. If nCoV brought the near-term prospects of new LNG business to a particularly slow crawl, we believe the OPEC+ blow up will bring it to a full stop, at least until the dust settles. For companies in the process of restructuring (like TELL).….continued on Pages 2-3

For access please email us at [email protected]


Read More

Venture Global LNG: Costs Ramping At Calcasieu?

Headcount, Parking Data Suggest Material EPC Inflation

For access information, please email us at [email protected]

  • Construction Details:                                                           Pages 1-2
  • Parking & Headcount estimates                                        Pages 2-3
  • Previous CPLNG Cost Curve                                               Page 3
  • Our New CPLNG Labor Cost Estimates                           Page 3 
  • EPC Costs – Expanded                                                         Page 4
  • Key Questions From Here                                                   Pages 4-5

Forcasted Ramp In Craft Labor Headcount Indicate Costs Likely Trending Above Plan. Recent filings indicate that Calcasieu Pass LNG’s (CPLNG) average on-site workforce is set to more than double compared to company Pre-FID plans, while also introducing a night-shift. While there are likely several variables in play here, we believe the data (analyzed in the pages that follow), suggests that CPLNG’s on-site craft labor costs could increase materially……(data and our estimates on pages 2-5).

Parking Lot Infrastructure: In addition to the craft labor increases, there’s usually an increase in both indirect construction support infrastructure and the associated cost for that infrastructure. An example of this phenomenon is the reported increases by CPLNG in parking lot infrastructure. While not usually top-of-mind, ancillary factors like parking carry a real cost for projects this large, and significant increase in parking requirements would be felt in a projects budget. This same correlation is true for other indirect costs like lunch tents, lavatories, office spaces, personal protective equipment, health & safety supervision, small tools and consumables, radios and other IT equipment, trash removal, security, craft training, and on and on. That trend in data over the past year shows….(continued on pages 2-3).

While there could be several explanations for the ramp in labor (too many to list within a single note), if we were stakeholders we’d want to understand what’s actually driving the ramp in labor, and how any associated overrun in direct and indirect costs are being accounted for by CPLNG. While our cost overrun estimate (pages 2-3) is just that – an estimate – we’re confident the
fundamental relationship between labor head count and project costs have us pointed in the right direction.
Click here to buy this report

Read More