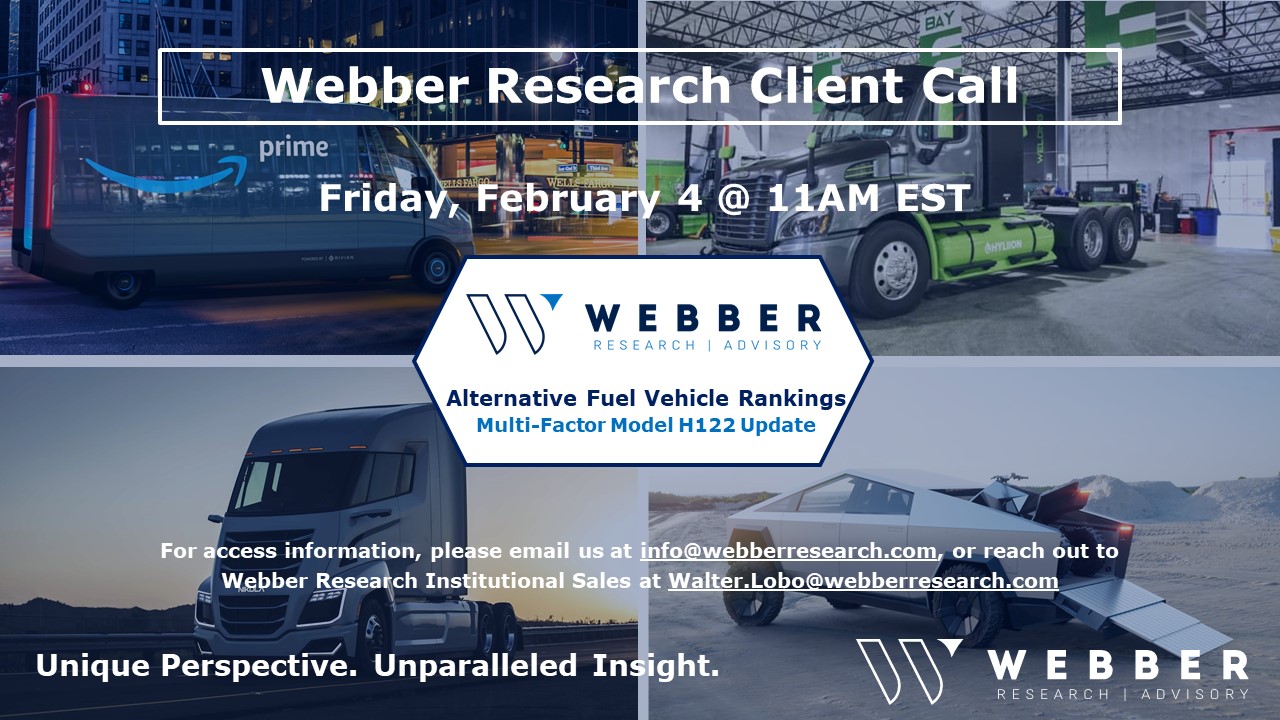
W|EPC: Future Of Transportation – Ranking & Evaluating Alternative Fuels – H2 ∙ BEV ∙ Methanol ∙ CNG Hybrid ∙ Ethanol ∙ Ammonia ∙ Diesel ∙ Biofuels
If you’re a current Webber Research subscriber you access this presentation via our Client Login above. If you’re not yet a subscriber, please contact us at [email protected] for access information.
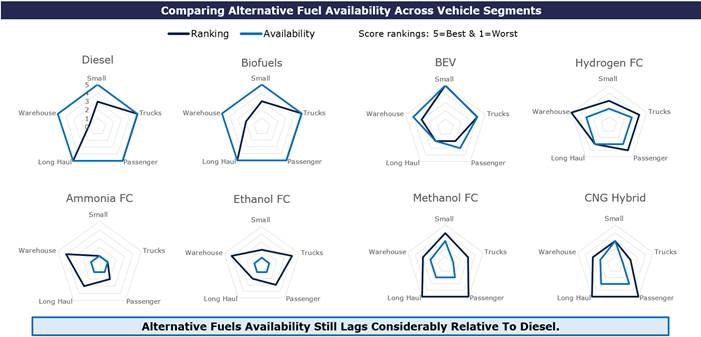
Alternative Fuel Analysis…Will History Repeat Itself?
In 1992 & 2005, the Department of Energy (DOE) created & amended the Energy Policy Act (EPA) that addressed fuel research and tax benefits for vehicle manufacturing.
Battery Electric Vehicles (BEV), Hydrogen (H2), Hybrids, Biofuels, Ethanol and Methanol were analyzed in 2005, but vehicle manufacturers supported gasoline hybrid vehicles due to technology and production constraints.
Since then, fuel cell technology and global, federal, & state emission guidelines have accelerated innovation and the market is now actively deciding transportation alternatives.
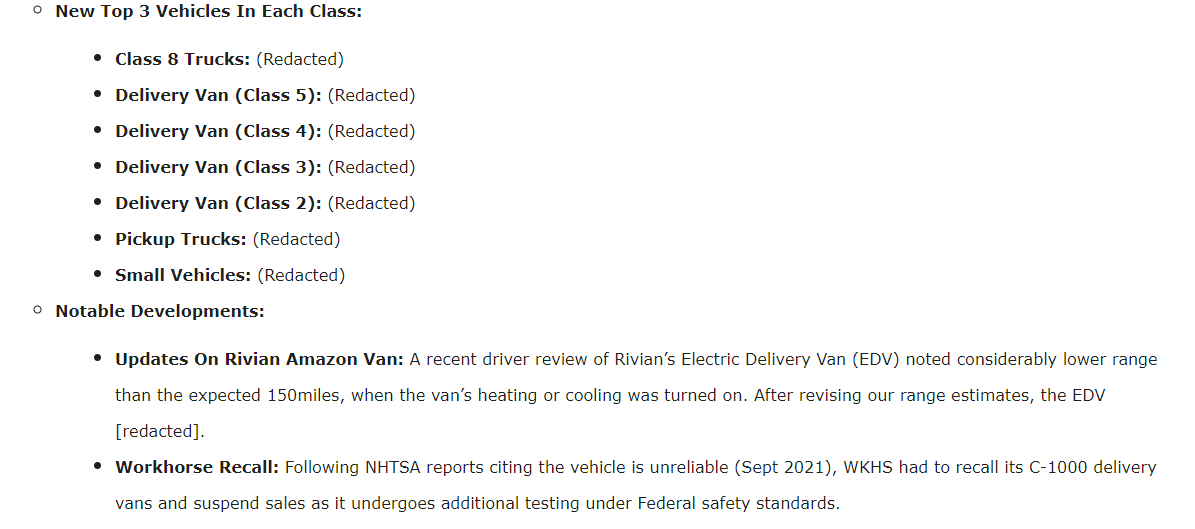
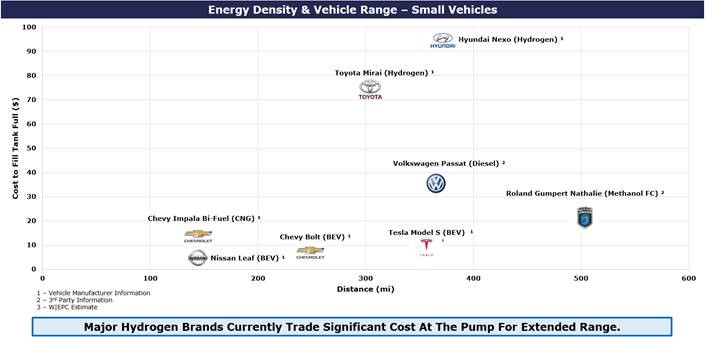
Small Vehicle Applications
BEV have taken a leading role in the small vehicle category with minimal competition from Hydrogen.
Hydrogen’s price, lack of infrastructure, and safety concerns highlight the risk associated with new fuel applications; however, Methanol may have an opportunity to fill this role.
The Roland Gumpert Nathalie markets an impressive range and methanol costs are comparative to BEV, but the $450k price tag limits it’s applications until manufacturing scales up to reduce cost.
 Mid-Sized Vehicles and Truck Applications
Fuel energy density becomes a larger role as the size of a vehicle increases.
Fuel storage capacity, energy density, and vehicle efficiency play a large role in the range and cost for a vehicle.
Semi-Truck Range Is A Gating Issue For Future Fuels
New Semi-Truck concepts are ranging from shorter applications (<300 miles) to the long-haul market (>600 mile/day).
Daimler eCascadia seems to make sense for shorter applications and Hyliion’s Compressed Natural Gas (CNG) hybrid semi will likely apply well to long haul trades, if the marketing is as good as advertised.
W|EPC: Future Of Transportation – Ranking & Evaluating Alternative Fuels – H2 ∙ BEV ∙ Methanol ∙ CNG Hybrid ∙ Ethanol ∙ Ammonia ∙ Diesel ∙ Biofuels
Read More
 client log-in