 client log-in


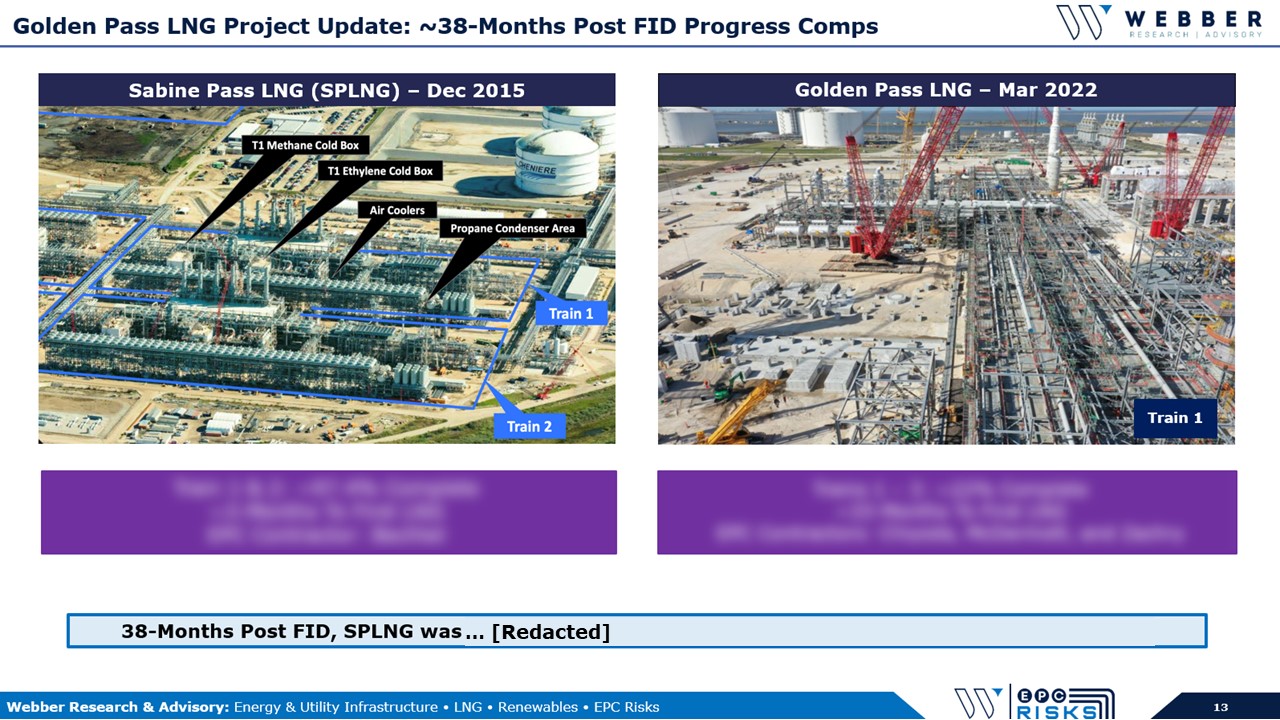
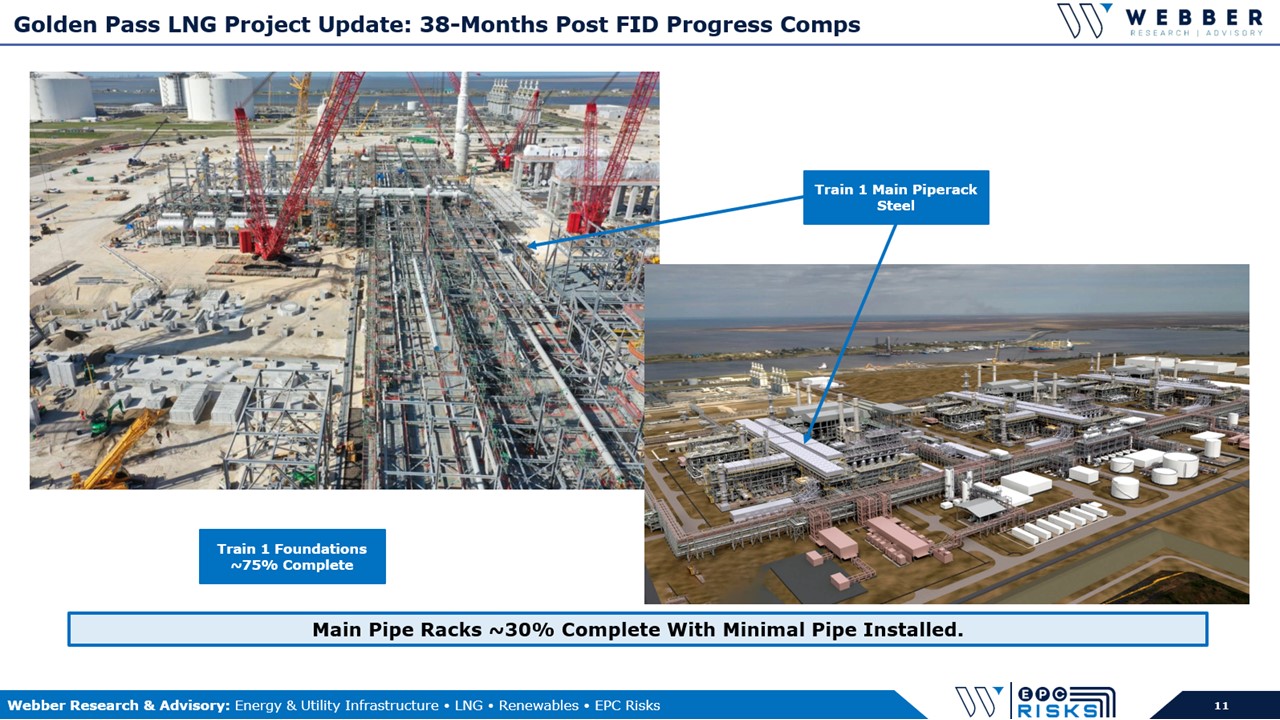
W|EPC: Kinder Morgan’s Elba Island – Analyzing ~$350MM In Project Claims vs. EPC LSTK Wraps (May 2023)***


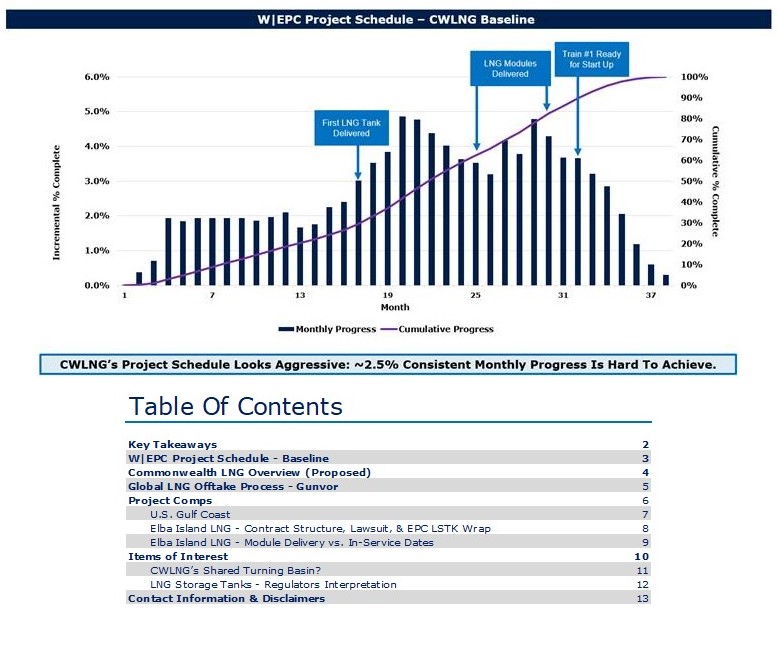

W|EPC: Mozambique LNG – Baseline Report & On-Site Satellite Image Analysis (Q121)
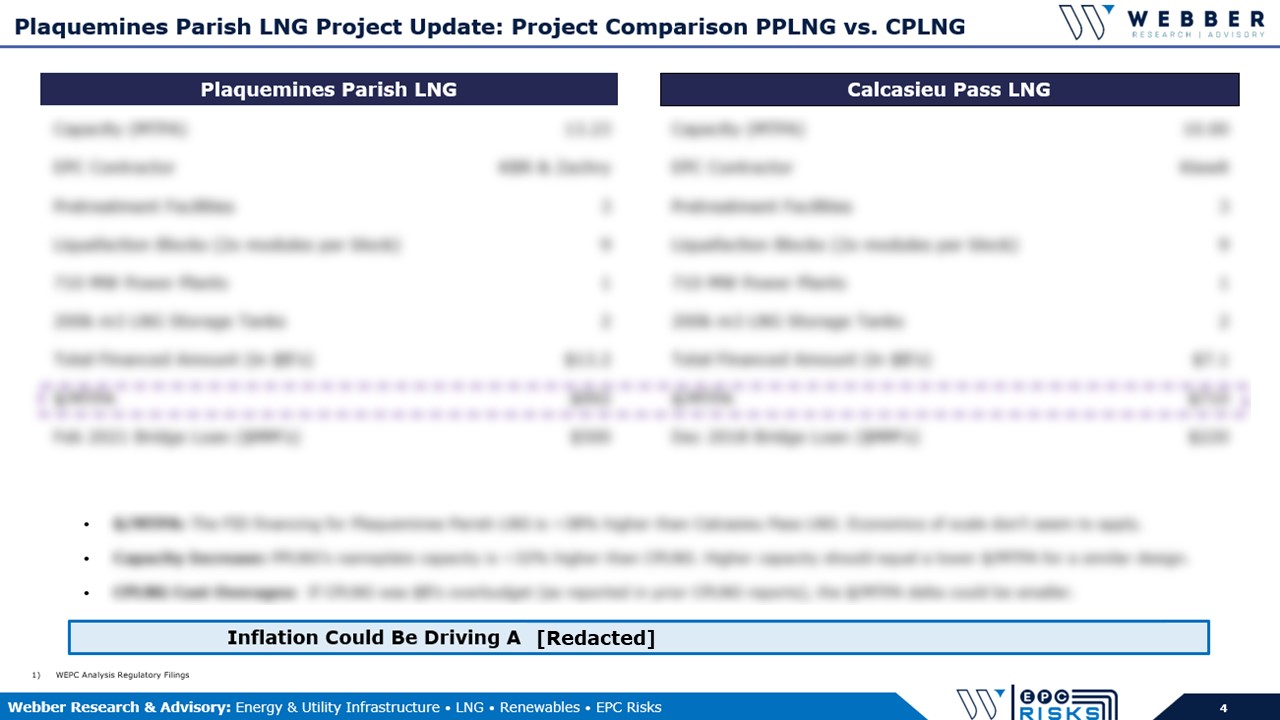
Total Pages: 20
Table Of Contents
- Update On Terrorist Attacks: Force Majeure (Page 2)
- Key Takeaways (Page 4)
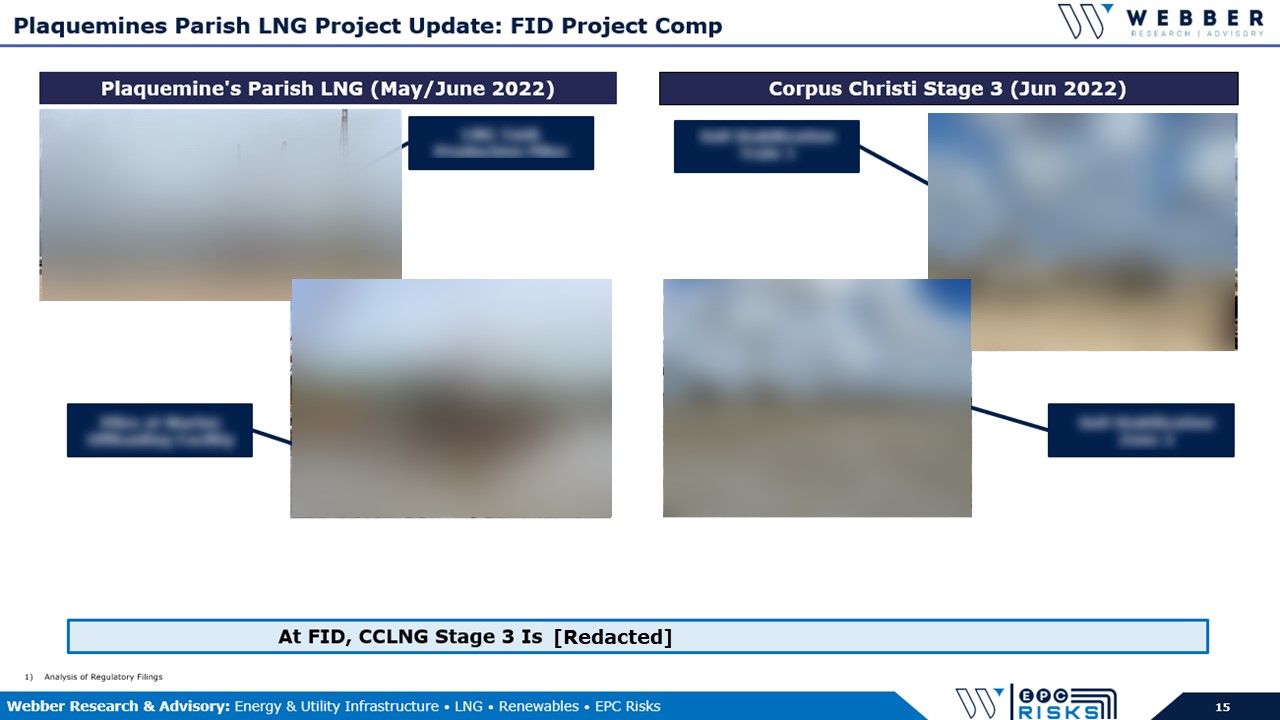
- Project Comps: ~14 Months Post FID (Page 4)
- Project Risk Profile (Page 5)
- W|EPC Proprietary Risk Model (Page 5)
- Mozambique LNG Overview (Page 6)
- Schedule (Page 7)
- Construction Spend (Page 8)
- EPC Consortium (Page 9)
- Ownership (Page 10)
- Unique Project Risks (Page 11)
- Satellite Image Analysis (Page 14)
- Contact Information & Disclosures (Page 18)
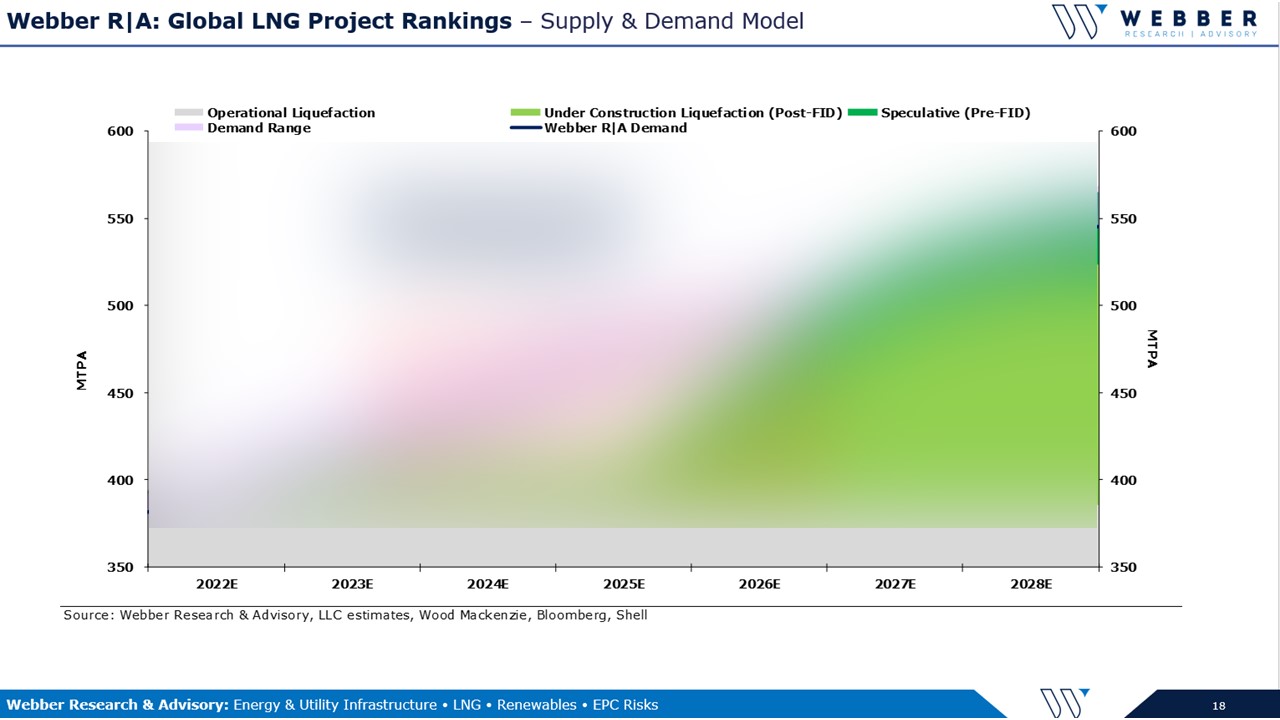
Key Takeaways:
1) Mozambique LNG (MZLNG): After A Sluggish Start…The Next 6 Months Are Critical…
Q320 & Q420 satellite images indications… (pgs. 15-18)
17-months after FID, meaningful piling, concrete, &/or structural steel erection [redacted]…
Recent security issues (increasingly localized terrorism) could further hamper staffing levels & complicate the path forward (while also potentially creating the pretense for Force Majeure relief)
2) Schedule Analysis & Estimates:
Our proprietary risk model implies a probability of the project meeting its cost/schedule metrics is [redacted] (page 5)
EPC Contract Exposure: ~$8B LSTK contract, via a consortium comprised of Saipem (74.95%, SAPMF), McDermott (24.98), MDR) & Chiyoda (0.07%,)
A successful project would boost Saipem’s reputation, while also certainly meaningful for a restructured MDR ($560MM Raise on Jan 5, 2021).
3) Mozambique vs. LNG Canada
MZLNG & LNG Canada share similarities, including: a remote area, greenfield, man-camp, etc. (page 4)
Key differences: MZLNG’s has lower-cost construction wages, shorter project schedule, but 300% more peak labor (~11k craft workers).
Should MZLNG require even more labor given the circumstances described in pages that follow, it would likely require an even more significant pull from local labor (on-site housing can support ~9.5k workers).
MZLNG is located in one of the least developed areas of Mozambique, which creates unique risks around that heavy lean on local labor, even before considering the uptick in localized terrorism. (page 12)
4) Mozambique LNG: Baseline Report Q121


W|EPC: Hydrogen Roadmap – Future of Vehicle Transportation (Part 2) – Alternative Fuels – Efficiency & Safety
Total Pages: 20
Table Of Contents
Key Takeaways
- W|EPC Rankings: Fuels vs Fuel Cells – Page 3
Vehicle Transportation – Efficiency
- Production Efficiency: Grid To Tank – Page 5
- Vehicle Efficiency vs Energy Storage: Small Vehicles Page 6
- Vehicle Efficiency vs Energy Storage: Mid-Size & Trucks Page 7
- Vehicle Efficiency vs Energy Storage: Semi-Trucks Page 8
Vehicle Transportation – Safety
- OSHA Ratings – Page 10
- Fuel Analysis From Baker Risk – Page 11
- NFPA Spacing Considerations – Page 12
- Ignition Contours From Baker Risk – Page 13
- Relevant Comp: Canada’s Sunrise Propone Issue – Page 14
Technology Leaders & Applications
- Fuel Cell Companies & Applications – Page 16
Hydrogen Roadmap to Transportation
- Layout & Overview – Page 17-18
- Contact Information & Disclosures – Page 19-20
Key Takeaways:
1) Trillions Or Billions In Renewable Energy – Vehicles Decide?
A Carbon Neutral transportation network could require significant capital spending for a new renewable energy production and distribution systems.
Some renewables (e.g. Solar and Wind energy) are variable daytime resources not available during peak energy demand. Hydrogen, Methanol, and Ammonia from electrolysis (eFuels) can be utilized to store this energy.
A vehicle’s efficient use of that energy will determine the required energy production and supporting infrastructure costs.
2) BEV Energy Efficiency Is Unchallenged
Battery Electric Vehicle’s (BEV’s) are ~3-10x more efficient in the use of energy across nearly all vehicle segments.
Real world conditions (i.e. AC, weight, aerodynamics, temperature of the battery, high speeds, etc.) limit BEV efficiency in different regions.
Vehicle batteries can lose up to ~30% of their storage capacity by ~100k-150k miles. The cost to replace a semi-truck battery may be ~$100k. Long-haul truckers can average more than 100k miles a year.
3) Hydrogen Fueling Networks: Risks & Potential Legislation
U.S. Hydrogen fueling station spacing is currently determined by NFPA-2 (Flammability), which has a narrow scope relative to international standards.
Lessons From Canada: Under relatively similar dynamics, safety issues (Sunrise Petroleum, etc.) led Canada to materially shift propane fueling regulations, largely at the expense of early adopters. We see similar regulatory uncertainty as a potential risk for H2 fueling infrastructure.
4) Canadian Propane Comp: Applying Canada’s revised Propane Fueling Regulations to existing US fueling infrastructure highlights the potential hurdles in play: a 1.0psi pressure wave from 250kg of H2 storage could cause damage over…..

W|EPC: Future Of Transportation – Ranking & Evaluating Alternative Fuels – H2 ∙ BEV ∙ Methanol ∙ CNG Hybrid ∙ Ethanol ∙ Ammonia ∙ Diesel ∙ Biofuels
Total Pages: 19
Table Of Contents
- Key Takeaways – Page 2
- W|EPC Rankings: Fuels vs Fuel Cells – Page 3
Alternative Fuels – Applications
- Vehicle Applications – Page 5
- Vehicle Availability – Page 6
- Comparing Application vs Availability – Page 7
Vehicle Transportation – Fuel Comps
- Small Vehicle Range – Page 9
- Energy Density & Vehicle Range: Small Vehicles – Page 10
- Energy Density & Vehicle Range: Mid-Sized & Trucks – Page 11
- Semi Truck Considerations – Page 12
- Energy Density & Vehicle Range: Freight & Semis – Page 13
Technology Leaders and Applications
- Fuel Cell Companies and Applications – Page 15
- Hydrogen Roadmap to Transportation – Page 16-17
- Contact Info & Disclosures – Pages 18-19
Key Takeaways:
1) Alternative Fuel Analysis…Will History Repeat Itself? In 1992 & 2005, the Department of Energy (DOE) created & amended the Energy Policy Act (EPA) that addressed fuel research and tax benefits for vehicle manufacturing.
Battery Electric Vehicles (BEV), Hydrogen (H2), Hybrids, Biofuels, Ethanol and Methanol were analyzed in 2005, but vehicle manufacturers supported gasoline hybrid vehicles due to technology and production constraints.
Since then, fuel cell technology and global, federal, & state emission guidelines have accelerated innovation and the market is now actively deciding transportation alternatives.
2) Small Vehicle Applications: BEV have taken a leading role in the small vehicle category with minimal competition from Hydrogen.
Hydrogen’s price, lack of infrastructure, and safety concerns highlight the risk associated with new fuel applications; however, Methanol may have an opportunity to fill this role.
3) Mid-Sized Vehicles and Truck Applications: Fuel energy density becomes a larger role as the size of a vehicle increases. Fuel storage capacity, energy density, and vehicle efficiency play a large role in the range and cost for a vehicle.
Chevy Silverado 1500: 1000 miles & ~$0.11/mile
Tesla/Rivian: 400-500 miles & $0.05/mile
Nikola Badger (on hold): 600 miles & ~$0.20/mile
4) Semi-Truck Range Is A Gating Issue For Future Fuels
New Semi-Truck concepts are ranging from shorter applications (<300 miles) to the long-haul market (>600 mile/day).
Hydrogen will be limited by fuel price and infrastructure but by using Methanol as an energy dense carrier for Hydrogen in the vehicle may allow for equivalent distance at ~1/6 the cost.


W|EPC: Analyzing Energy Project Contract Terms – Risks, Strategies & Comps
Total Pages: 15
Table Of Contents
W|EPC: Analyzing Energy Project Contract Terms – Part 1 – Risks, Strategies & Comps Across Stakeholder Groups – Q420
- Key Takeaways – Page 2
- EPC Contracts Analyzed – Page 3
Overview – Notable Risks for Any Projects
- Third-Party Indemnification – Page 5
- Performance Guarantees – Page 6
- Rely-Upon Information – Page 7
Contract Analysis, Significance, Negotiation Strategies, & Comps
- Third-Party Indemnification – Page 9
- Performance Guarantees – Page 12
- Technical Risk Allocation – Page 15
Key Takeaways:
1) Analyzing EPC Risk Avoidance: Comps & Techniques For Investors, Owners, & Contractors
W|EPC analyzed ~$20B of publicly available EPC lump sum turn-key (LSTK) contracts, focusing on sensitive or contentious terms used to allocate risk, manage performance expectations, & establish a framework for third-party indemnification and liquidated damages, etc. (Pages 3, 5-7, & 9-17). Specific points of emphasis:
Investors: Leveraging a project’s future expansion plans to protect ROE and/ maximize options (ROFR) options. (Pages 5, 9-11)
Owners: Finding & justifying onerous contract terms as market or on-the-run.
Contractors: Avoiding those onerous contract terms.
2) Analyzing Notable Risks:
Liability & Indemnity: Existing Facilities can be problematic for Contractors & expose stakeholders. (Pages 5, 9-11)
• Performance Guarantees & Damages: Numerous performance guarantees were publicly disclosed (likely inadvertently) that illustrates risks & production, emissions, and/or power consumption liabilities. (Pages 6, 12-14)
• Technical Risk Allocation: One project’s subsurface provisions are tighter and limit change orders provisions for differences in soils data. (Pages 7, 15-17)
3) Distributing Project Risk Amid A Ramp In Renewables
The steep ramp in renewables demand & project development could create an opportunity/leverage for participating EPC providers to ultimately own less project risk.
Certain renewable projects could struggle getting an EPC
LSTK contract (typically advantageous for the project owner, at the expense of the EPC provider). Dominion Energy (D), for instance, was unsuccessful in finding an EPC provider to provide a LSTK contract for their Coastal Virginia Offshore Wind (CVOW) project.
EPC providers may have some leverage here, at least for now. W|EPC believes integrating EPC contract strategies/terms earlier than traditional projects (i.e. hydrocarbons) will improve risk/reward.


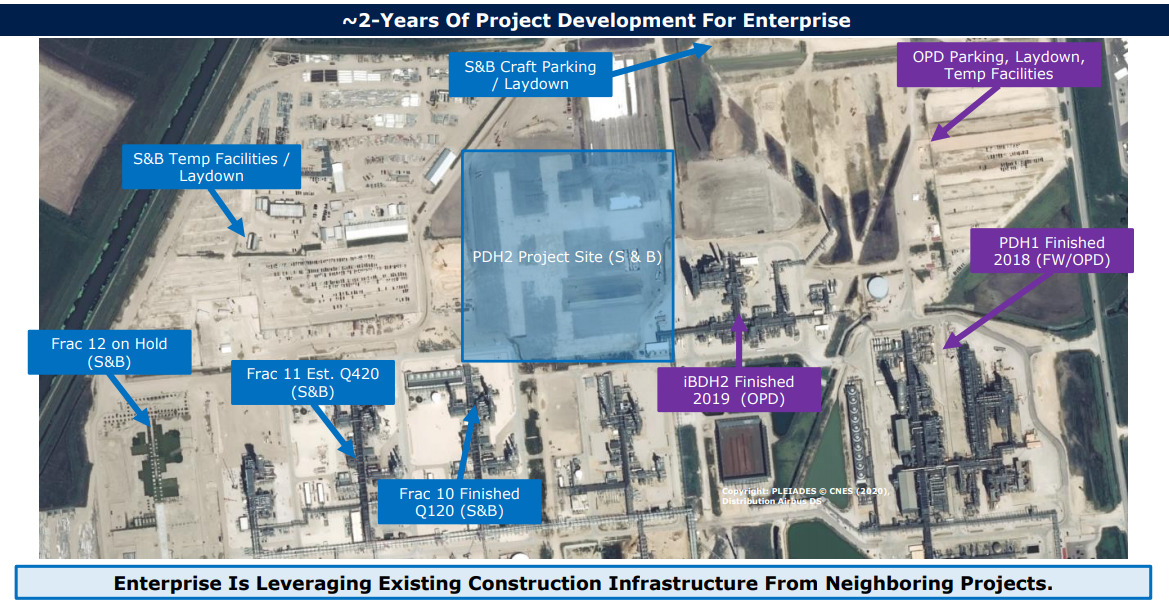
W|EPC: Enterprise (EPD) PDH-2 Q420 Project Monitor & Satellite Image Review
Total Pages: 18
Table Of Contents
W|EPC: Enterprise (EPD) PDH-2 Q420 Project Monitor & Satellite Image Review
- Key Takeaways – Page 2
Cost & Schedule Updates
- Cost Forecast – Page 4
- Project Milestones – Page 5
- Progress Analysis – Page 6
- Project Comps – Page 7
- On-Site Staffing – Page 8
Analysis & Satellite Image Review
- Analysis – PDH 2 Recovery Potential – Page 10
- Recovery Plan Risk – Page 11
- Progress Comparison – Page 12
- Staffing Comparison- Page 13
- ~2 Years Of Project Development For EPD – 15
- October 2020 Satellite Image – 16
Key Takeaways:
1) EPD PDH 2 Project Delay Analysis
Based on Q420 aerial project site images, W|EPC estimates Enterprise Products (EPD) PDH behind schedule by roughly… (pages 4 – 7)
In Q220, EPD announced a 3-month schedule slip (from Q123 to Q223), potentially limiting future change orders (i.e. cost escalation) related to COVID impact (based on typical EPC contract FM concepts).
To reduce the COVID delay to only 3 months, we believe EPD implemented a schedule recovery plan that accelerated/compressed back-end construction activities to meet a Q423 COD forecast. (pgs. 10 – 13)
2) Enterprise’s First ESG Guidance… :
On October 28, 2020, EPD released their approach to ESG. In the report, EPD touts they are the largest Midstream producer of Hydrogen.
With the addition of PDH2, Enterprise would increase their Hydrogen production by [REDACTED] and could produce [REDACTED] by incorporating fuel cells in their Mont Belvieu, TX facility.
Companies like SK are working with fuel cell manufacturers to integrate high temperature Solid Oxide Fuel Cells (SOFC) into PDH units to use the hydrogen produced to reduce operating costs….this could help EPD’s ESG potential.
3) Schedule Recovery Risks & Benefits:
A schedule recovery plan can be costly and is not guaranteed to succeed. PDH 2 schedule recovery risks/benefits include:
Risks – An EPC lump sum contractor (S&B) compresses the schedule & may cause inefficient construction & cost escalation.
Benefits – The COVID delay started before site prep and avoided a de-staffing of the project. Based on limited on-site progress, S&B likely hasn’t spent much of their field budget & may have available contingency to support acceleration costs/inefficiencies.
W|EPC’s Recovery Plan shows site labor and progress can support pulling activities back to Q223 with a probability of success of…. (pgs. 10-13)

W|EPC: Southern Company (SO) – Q420 Vogtle Project Monitor – Key Decisions That Could Haunt Cost Prudency
Total Pages: 26
Table Of Contents
W|EPC – Vogtle Nuclear Q420 Project Monitor
- Key Takeaways – Page 2
- Who Own $2.1B In Cost Overruns – Page 3
- Georgia Public Service Commission 2018 – Page 4
- Cost Prudency Definition & Process – Page 5
Decisions That Could Haunt Georgia Power/Southern Company
- LSTK Contract Mismanagement – Page 7
- Bankruptcy – Parent Co. Guarantee Settlement – Page 8
- Estimate to Complete – Page 9
- Transition from EPC LSTK to T&M – Page 10
- QRA – Cost – Page 11
- QRA – Schedule – Page 12
GP Testimony & W|EPC Analysis (2009 to 2017)
- EPC Contract Overview – Page 14
- October 2009 – Page 15
- October 2010 – Page 16
- April 2011 – Page 17
- November 2012 – Page 18
- June 2013 – Page 19
- October 2014 – Page 20
- October 2015 – Page 21
- December 2015 – Settlement of LD’s – Pages 22
- December 2015 – Revised EPC Contract – Page 23
- October 2016 – Page 25
- April 2017 – Page 26
- Disclosures
Key Takeaways:
1) Who Will Be Getting Stuck With +$2.1B In Cost Overruns?
Once Vogtle Unit 4 reaches “fuel load”, Georgia Power/Southern Company (GP/SO) can request a cost prudency determination to push their portion of cost overruns (~$2.1B) into recoverable utility rates. (Page 4)
Regulators will determine cost prudency based on project data, testimony, and a simple question: What should a reasonable manager have done at the time of the decision? (Page 5)
We expect that process to be heavily scrutinized considering the scale of the overruns, and, in our opinion, some questionable GP/SO decisions.
2) Decisions That Could Haunt GP/SO’s Prudency:
We believe there’s a case to be made that multiple GP/SO management decisions ran contrary to industry standards, potentially contributing to ($) billions in cost overruns, including:
- A failure to either include or implement multiple EPC contract……(Page 7)
- For the first 4-years of the project, GP/SO used only…..(Page 23)
- In 2017, it appears GP/SO did not validate critical underlying EPC…..(Pages 9- 10)
3) Analyzing 12-Years Of GP & SO Testimony… (Pages 20 & 23)
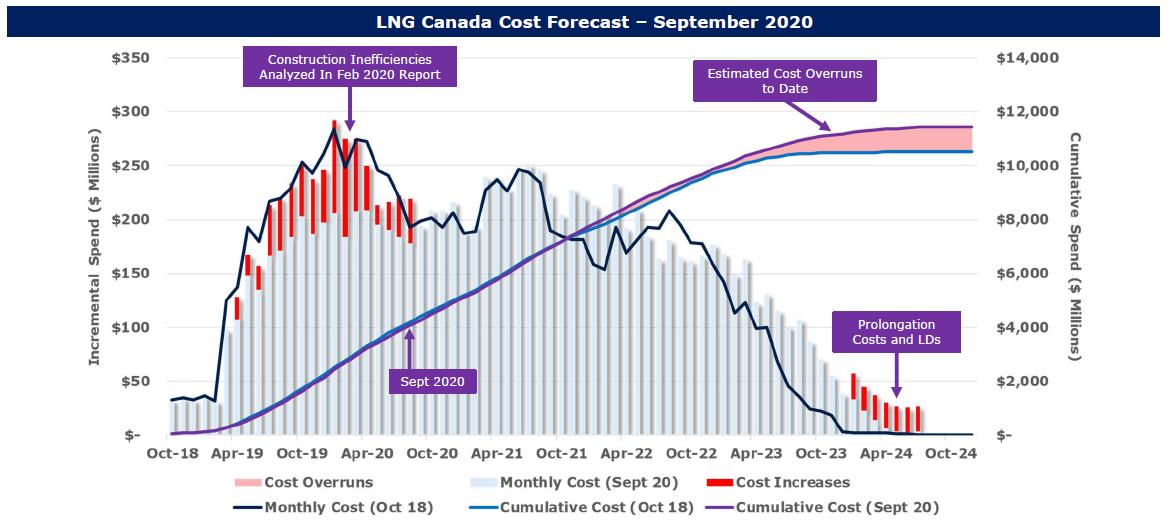
W|EPC: LNG Canada – Updated Satellite Image Analysis & Construction Progress – Q420 Project Monitor
Total Pages: 14
Table Of Contents
W|EPC – LNG Canada – Q420 Project Monitor
- Key Takeaways – Page 2
LNG Canada Cost & Schedule Updates
- Updated Estimates – Page 4
- Project Milestones – Page 5
- Progress Analysis – Page 6
- Analyzing Fluor’s 27.5% Reported Progress – Page 7
- Project Staffing – Page 8
Satellite & Aerial Image Analysis
- July 2020 Overview – Page 10
- September 2020 Site Analysis – Page 11
- July vs September 2020 – LNG Storage Tank – Page 12
- Module Yard Analysis – Page 13
Key Takeaways:
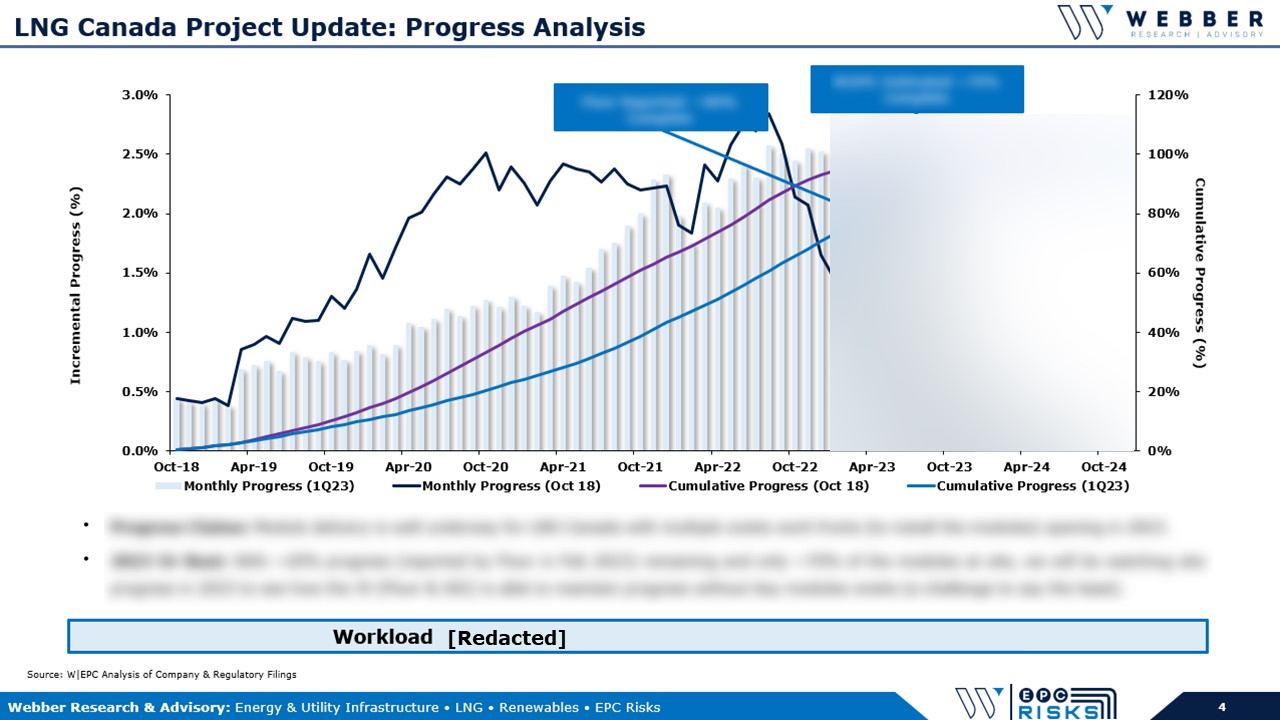
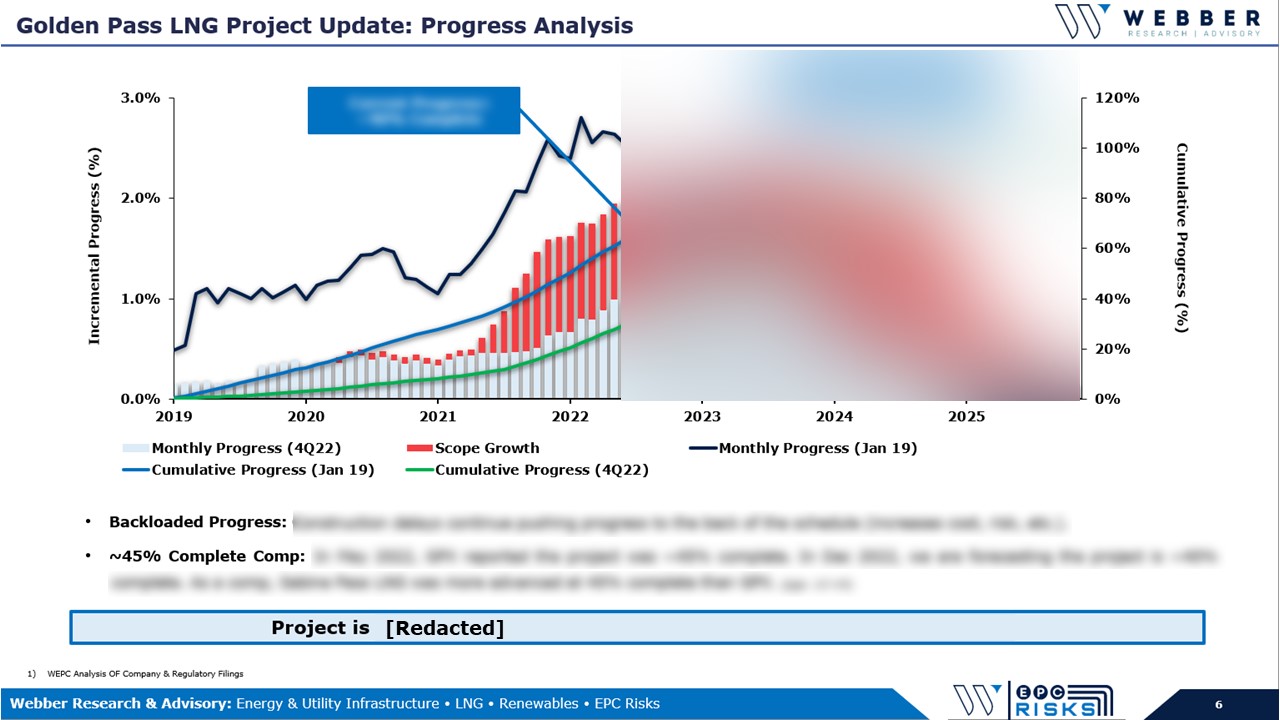
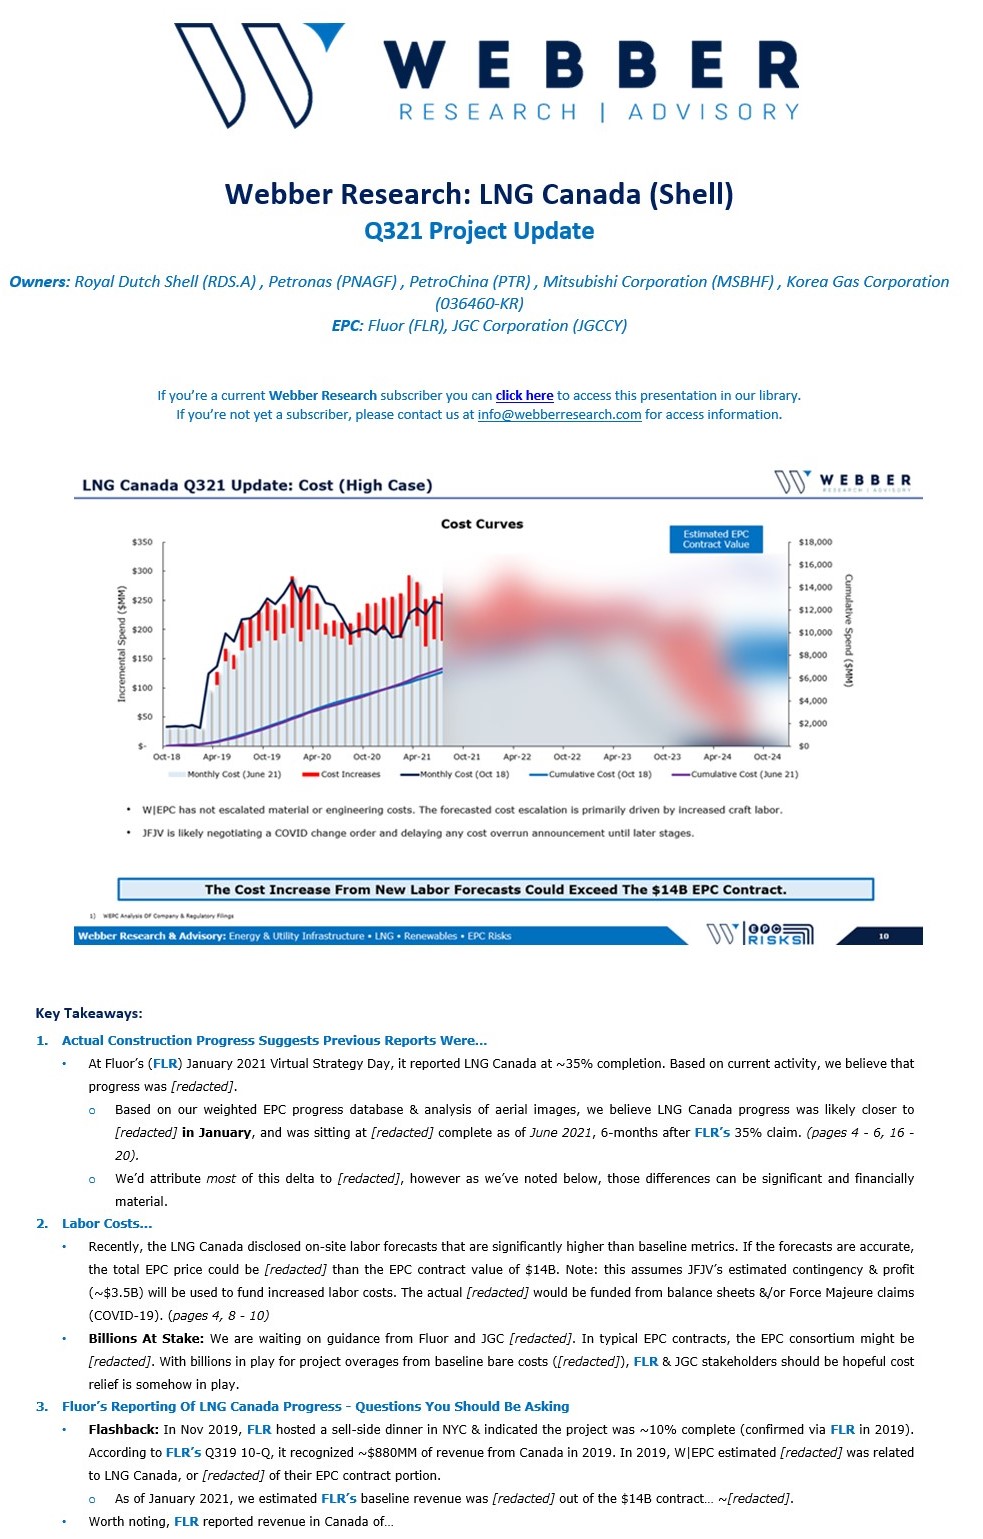
1) Delays At LNG Canada Continue to Build (Pages 4 – 7, 10 – 13):
Fluor reported ~27.5% Engineering, Procurement, Fabrication, & Construction (EPFC) progress in September, vs our current estimate of…
We believe Fluor’s 27.5% guidance implies module fabrication progress of ~45%, which is ~9x…
Fluor also referenced COVID-related project delays (without getting specific)
Our Current Delay Estimate:…..
Estimated Probability Of Maintaining Schedule:…..
Mind The Gap: There are several potential explanations for such a degree of progress variance…
2) Examining Fluor’s Goal of 2,500 On-Site Workers By Dec-20 (Pages 4, 8, 10 – 13) :
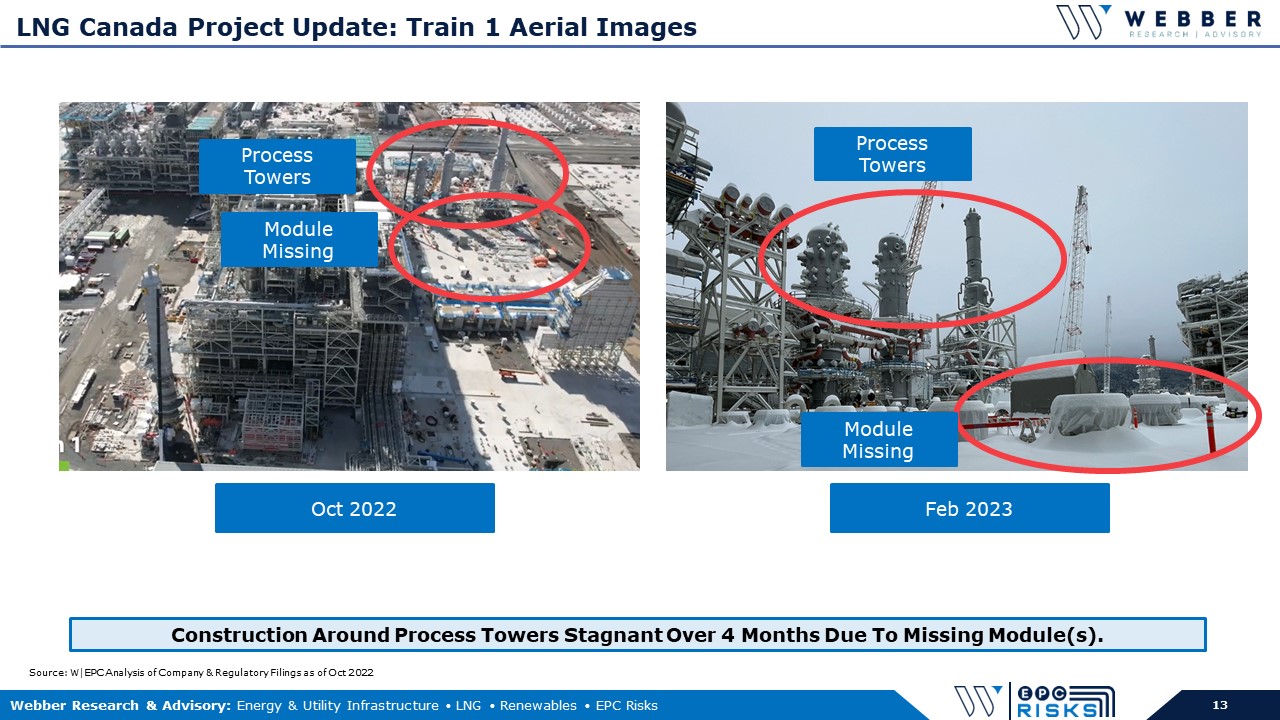
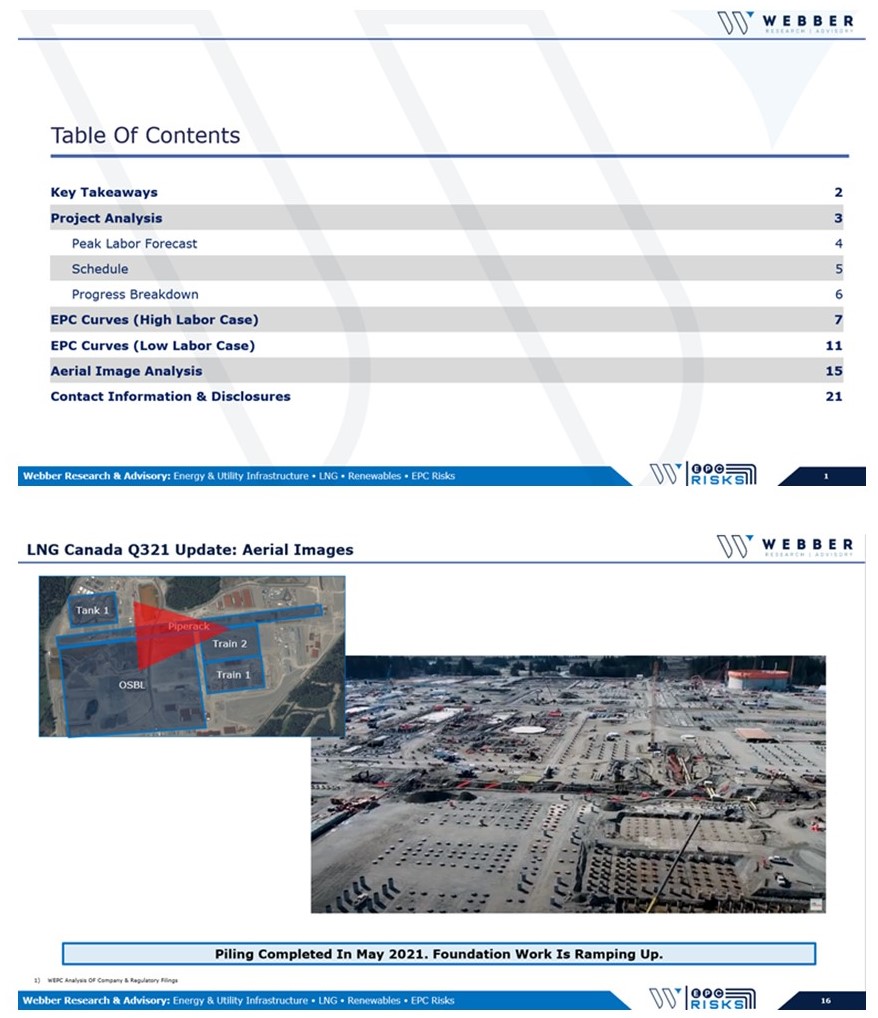
Aerial images suggest meaningful concrete, structural steel, and significant construction activities have yet to start (beyond piling)…
Pre-COVID, Fluor’s reported onsite labor was higher than the project’s publicly reported staffing levels, leading to cost overruns (Pages, 4, 8)
Limited construction work fronts could constrain Flour’s ability to…
3) Kicking The Can Down The Road… LNG Canada Starting to Resemble Another Fluor/JGC Project… (Pages 4, 8):
In 3Q13, CPChem awarded Fluor & JGC a ~$6B EPC contract for an Ethylene Cracker in Texas. ~39-months later, Fluor/JGC announced the project would be over budget. The project was finished in mid-2018 (a year behind its baseline plan).
~23-months after FID, we believe the LNG Canada (JFJV) schedule is slipping and costs are…


W|EPC: The Production Hydrogen (H2) Production Roadmap – The Upstream, Midstream, & Downstream Process – Hydrogen ∙ Ammonia ∙ Methanol
Total Pages: 30
Table Of Contents
- Key Takeaways And Flow Of H2 & CO2 – Page 2
Hydrogen’s Upstream
- Electrolysis Technologies & Market Leaders – Page 6
- Blue Hydrogen CO2 Issue – Page 7
- Hydrogen Is Getting Cheaper – Page 8
- Carbon Capture Systems & CO2’s Critical Role – Page 9
Hydrogen’s Midstream – Transportation
- Ammonia Transportation – Green Hydrogen – Page 12
- Methanol Transportation – Blue & Green Hydrogen – Page 14
- Cryogenic Hydrogen Energy Loss Concern – Page 16
Closer Look – Ammonia vs Methanol
- Hydrogen Comparison – Page 18
- Example Product Comparison – Page 19
- Converting Back To H2 – Page 20
- Ammonia & Methanol Co-Production Facilities – Page 21
Marine and Fuel Cell Comps
- Industry Impact – H2 Transportation – Page 23
- IMO Driving LNG, Ammonia Or Methanol Fuel For Ships – Page 24
- Carbon Neutral Marine Fuels – IMO 2050 – Page 25
- Ammonia & Methanol Co-Production Facilities – Page 26
Technology Leaders and Applications
- H2 – Industry Technology Leaders – Page 28
- Applying Technology In The EPC Process – Page 29
- Technology Packaging & Trends – Page 30
Key Takeaways:
1) Upstream Sources Of Hydrogen – Blue & Green (Pages 4 – 9) : >95% of Hydrogen (H2) is produced using Steam Methane Reformer (SMR) technology that produces 7 units of CO2/unit of H2 (on average)
SMR w/ a carbon capture system (Blue H2) is the preferred option to environmentally manage excess CO2. (page 7)
Green H2 provides minimal CO2 but current technology limits Green H2’s cost competitiveness. (Page 6)
2) H2’s Sprint To Market Share… Current Leaders (Pages 17 – 21, 27 – 30) : We analyzed 13 Technology Companies spanning 12 Process industries, including ThyssenKrupp, Air Products, Air Liquide, & KBR/Johnson Matthey…the clear technology leaders include…
3) Frozen Industries – Marine, Automotive, & H2 Transport (Pages 22 – 26) : Outside factors (i.e. carbon neutral fuels, fuel cells, regulations, safety, & other downstream applications) will play a large role in selecting the midstream transportation choice for H2.
International Maritime Organization’s (IMO) mandates for reduced emissions has many ship builders looking at LNG, Ammonia, and/or Methanol; without a clear long-term winner (yet), many shipbuilders are frozen.
Fuel pumps (gas stations) must receive H2 from high-pressure storage vehicles, pipelines, or by converting Methanol or Ammonia to H2 at the fuel pump, with a number of implications.…(page 20)
4) Midstream For Hydrogen – H2 Transportation Options (Pages 10 – 16)
Ammonia, Methanol, and Cryogenic H2 are used to transport H2 long-distances.
Ammonia is the clear favorite to…
Methanol is the best option for…
Cryogenic H2 technology/costs…


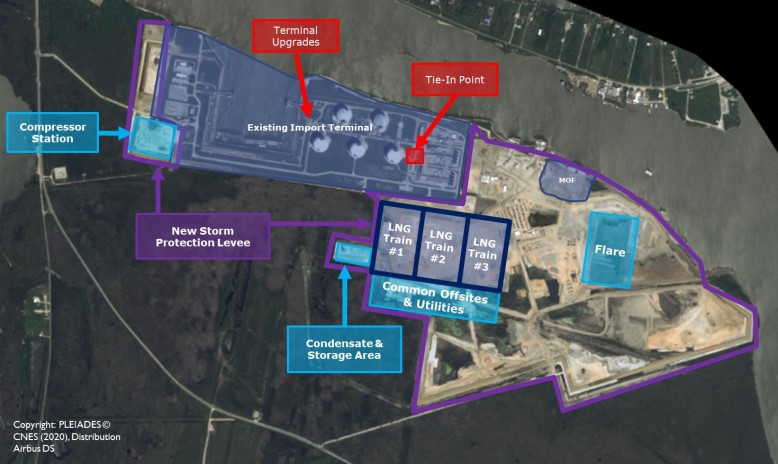
W|EPC: LNG Canada Q320 Monitor – Labor Dynamics & Baseline Satellite Image Review
Total Pages: 17
Table Of Contents
- LNG Canada Q3 Monitor: Key Takeaways
- Union Labor Agreements
- Contract Analysis & Estimates
- On-Site Construction Progress
- Awarded Construction Contracts
- Future Construction Contracts
- Labor Availability
- Project Estimates
- Satellite Image Analysis
- Baseline Site Satellite Image Overview
- Marine Terminals
- LNG Process Area
- LNG Storage Tanks
- Disclosures
Key Takeaways:
1) Union Craft Avg. Wage Rate Escalators & Impact On JGC/Fluor, and broader project cost…
What’s Happened/Changed: Part of our current focus is on LNG Canada’s wage rate escalation and union labor agreements post-2023.
Why Does That Matter: EPC lump sum proposals generally include labor escalation between 1-3% per annum (rates vary based on geography/availability). Labor agreements supporting LNG Canada and other B.C. projects expire in 2023 and have a relatively advantageous average labor escalation rate of…..continued.
For context, union labor strikes, renegotiated agreements, and significant wage rate escalation supported Gorgon LNG coming in $20B+ over budget.
What’s The Impact:…..continued (Page 3)
2) Taking A Look At JFJV’s Longer-Term Labor Inflation Risk (Page 5)
3) JFJV’s Construction Activity – What does it tell us about the project timeline? (Page 8)
4) Satellite Image Analysis Baseline – Benchmarks for Remainder of the Project…. (Pages 9-17)


W|EPC: Renewable Biofuel Analysis Refinery Conversions, Crack Spreads, & Risks Q420
Total Pages: 16
Table Of Contents
- Key Takeaways (page 2)
- Biofuels – Costs, Risks, & Incentives (page 3)
- Renewable Fuels vs. Traditional Refining Econ (page 4)
- Crack Spread Analysis – Ratios Matter (page 5)
- The California Renewable Fuel Rush (page 6)
- Biofuels & Soybean Oil Supply/Demand (page 7)
- Biofuels Project Tracker (page 8)
- Hydrogen’s Increased Demand in Biorefining (page 9)
- HVO vs FAME Biofuel (page 10)
- PSX’s Rodeo Refinery Conversion (page 11)
- Rodeo Refinery Conversion Overview (page 12)
- PSX Project Comp – WA vs. CA (page 13)
- EPC Dynamics (page 14)
- EPC Contractor Rankings (page 15)
Key Takeaways:
1) Renewable Fuel Production… Just in Time or Too Late? (Pages 4 – 8) California & Oregon have mandated Carbon Intensity (CI) reductions in transportation fuels, which could increase demand by ~350%, from ~400MM gallons/year to 1,400MM by 2025. Ten other states are evaluating similar LCFS programs, which could potentially push U.S. demand toward 2,400MM gallons/year, up ~600%…
2) Refinery Conversions: FAME vs. HVO (Page 9) Emerging trend in Biofuels: a transition from Fatty Acid Methyl Ester (FAME) to Hydrotreated Vegetable Oil (HVO), which provides biofuels a longer storage life & can be used in colder climates.
FAME & HVO biofuels are produced using a refinery’s hydrotreater & isomerization, or a hydrocracking unit with a steady supply of hydrogen. HVO economics are dependent on hydrogen prices & feedstock ratios.
3) Hydrogen’s Increased Demand in Biorefining (Page 10) As of early 2020, traditional oil refining consumed ~1/3 of the global Hydrogen demand. FAME biorefining requires similar Hydrogen consumption relative to traditional refining, but HVO biorefining uses significantly more Hydrogen depending on the process units…
4) Speed To Market Matters: Owners, Operators, & Contractors (Pages 12, 13, 15)
~10 years ago, companies were chasing another speed to market trend, NGL production and fractionation. Flexible and decisive companies (e.g. EPD, ET, etc.) quickly capitalized on this opportunity and captured market share.
Large Energy companies (e.g. Exxon, Shell, etc.) are not typically structured to move quickly refining industry (VLO, PSX, MPC) and take on the speed to market risk
W|EPC: Renewable Methanol & Hydrogen – Analyzing Methanex’s (MEOH) Geismar Facilities
Total Pages: 7
Table Of Contents
- Methanex & Renewable Methanol– Key Takeaways (page 2)
- Renewable Methanol (page 3)
- Methanol Feedstock & Applications (page 4)
- Hydrogen is Getting Cheaper (page 5)
- Renewable Methanol Facilities (page 6)
- Geismar Methanol Facilities (page 7)
- Methanex Overview (page 8)
- History – Geismar Units 1 & 2 (page 9)
- Geismar Unit 3 Comps (page 10)
- GU3 Cost Overview (page 11)
- Schedule – Key Milestones & Impact (page 12)
- Monthly Progress Curves (page 13)
- EPC Dynamics (page 14)
- Disclosures (page 16)
Key Takeaways:
1) Lower-Cost Hydrogen Will Produce Cost Competitive Renewable Methanol: Pipe Dream or Reality? Global methanol demand sits near ~75 MTPA; with demand expected to ramp amid new EU and U.S. environmental mandates. Renewable Methanol (RM) is produced using Hydrogen (H2) from solar/wind and carbon dioxide (CO2) as compared to traditional methanol produced from fossil fuels (i.e. coal & natural gas). (Page 4)
2) Cost-competitive RM would open the door to green plastics and support various marine, fuel, & vehicle clean energy mandates but, costs are not competitive based on current technology. (Pages 4 – 5)
3) Limited project economics hasn’t stopped ~10 commercial scale renewable methanol facilities in various stages of development around the world. As these projects develop, lower costs and improved technology would be a game changer for the methanol industry while providing H2 more downstream applications. (Page 6)
4) Tracking the 800 lbs. Methanol Gorilla…Methanex (MEOH). (Pages 8 – 9)
5) Geismar Unit 3: Positioning vs. Competition. (Pages 10 – 13)
6)The EPC Dynamics…So Long KBR, Next Up? (Page 15)

W|EPC: Gorgon LNG – Assessing Potential Operational Contributors To Kettle Cracks, Mid-October A More Likely Restart
Total Pages: 7
Table Of Contents
- Gorgon LNG – Shutdown Update & Analysis
- Highlights
- Executive Summary
- Gorgon LNG History, Partners
- Restart Timeline Estimates
- Analysis – Weld Issues & Chevron’s Response
- Propane Crack Repairs – Scenario Analysis
- Remaining Technical Questions
- Disclosures
Key Takeaways:
1) Pump The Breaks: While potential fabrication errors have been the primary narrative around the Propane Kettle cracks that shut down Gorgon LNG, it’s feasible that operational issues (and one in particular) may have contributed or even partially caused the cracks on Train-2’s kettles, which could have significant and more complex implications.
2) The propane kettle cracks were noticed ~3-years after the kettles were placed in-service (likely beyond any warranty period), potentially shifting costs to Chevron. According to our in-house engineers, a breakdown in the propane vapor transfer step could subject the propane kettles to temperatures significantly below the minimum design metal temperature; creating stress on the metal and an optimum environment to cause cracks.
3) If the root cause involved an operational issue, it would require not just replacement or repairs, but more robust inspections, testing, and training, which would add to the out-of-service timeline (Pages 2-4).
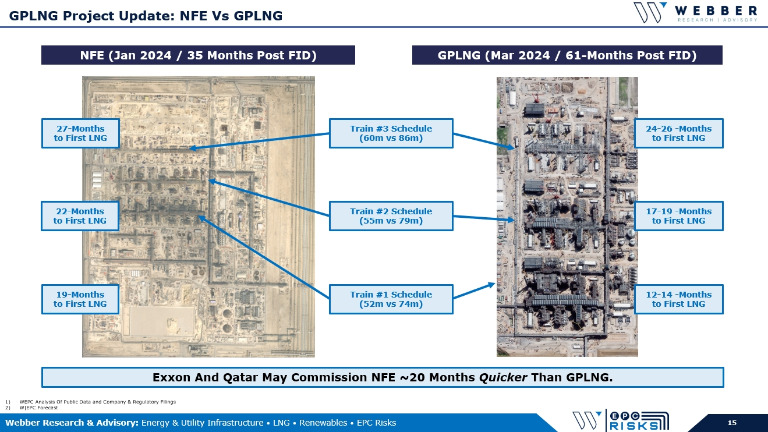
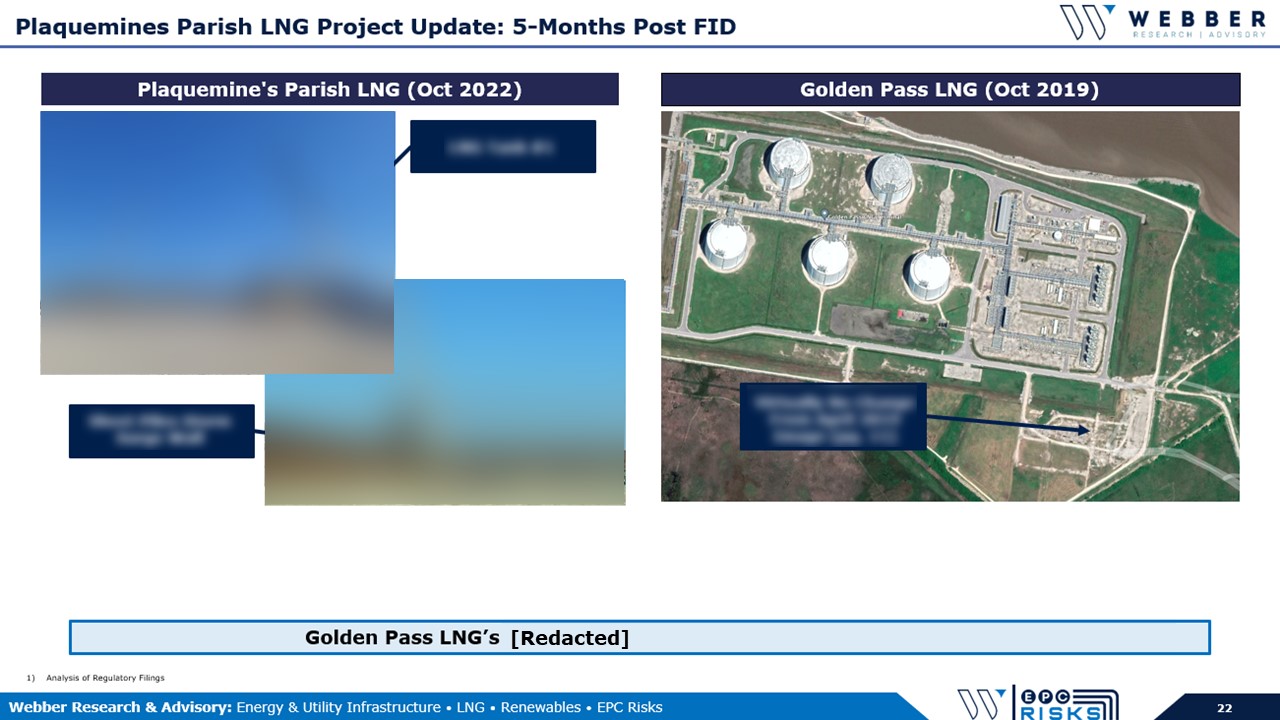
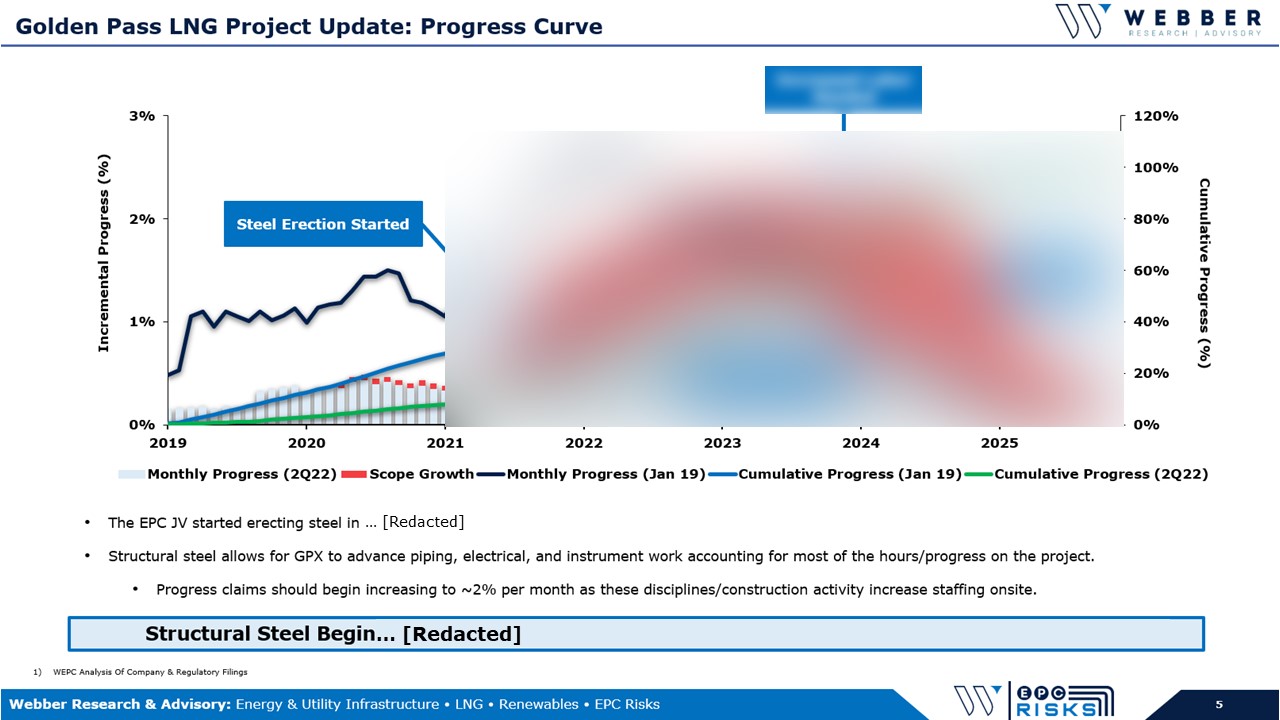
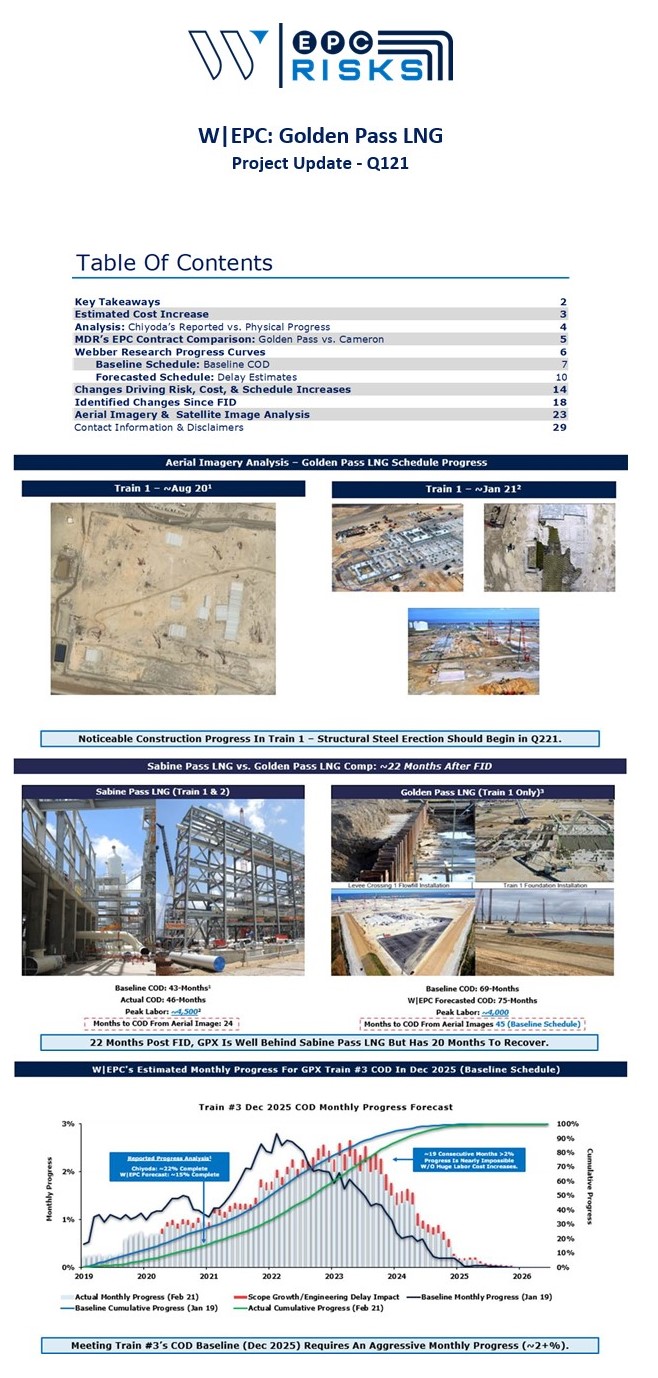
W|EPC: Golden Pass LNG – Delay & Contingency Fund Estimates Continue To Ramp – Updated Project & Satellite Image Review
Total Pages: 18
Table Of Contents
- Golden Pass Q320 Update – Key Takeaways (page 2)
- Revised Cost & Schedule Forecasts (page 3)
o Cost Forecast (page 4)
o Project Milestones (page 5)
o Progress Analysis (page 6)
o Analysis – Chiyoda’s 16% Reported Progress (page 7)
o Putting It All Together – W|EPC updated contingency fund and project delay estimates
o 18-Months After FID, Sabine Pass vs. Golden Pass LNG (page 8) - Joint Venture Analysis (page 9)
o Change Order Analysis vs. JV Structure (page 10)
o Possible Impacts to Chiyoda (page 11) - Satellite Image Analysis (page 12)
- Disclosures (page 17)
Key Takeaways:
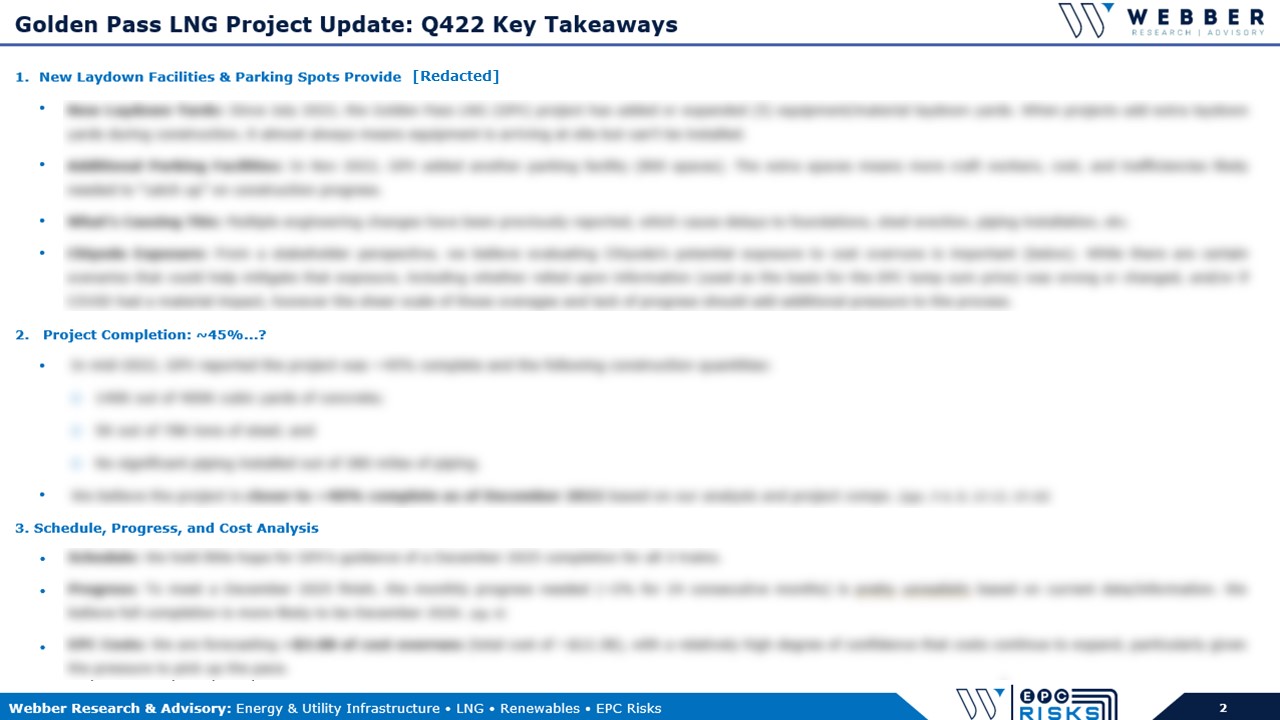
1) Chiyoda’s Engineering Delays Continue. We believe engineering delays have eroded a significant portion of the EPC risk, contingency, and profit, with the likelihood of ramping balance sheet exposure. (Pages 4 & 11)
2) Timeline & Cost Overrun Estimates. Our updated project timeline (delay) and contingency fund estimates are now material, sitting at….(continued)
3) Our estimates point to Golden Pass project progress sitting closer to ~10% vs Chyioda’s report figure of 16% (Q2) based on both our satellite image review and….(continued)
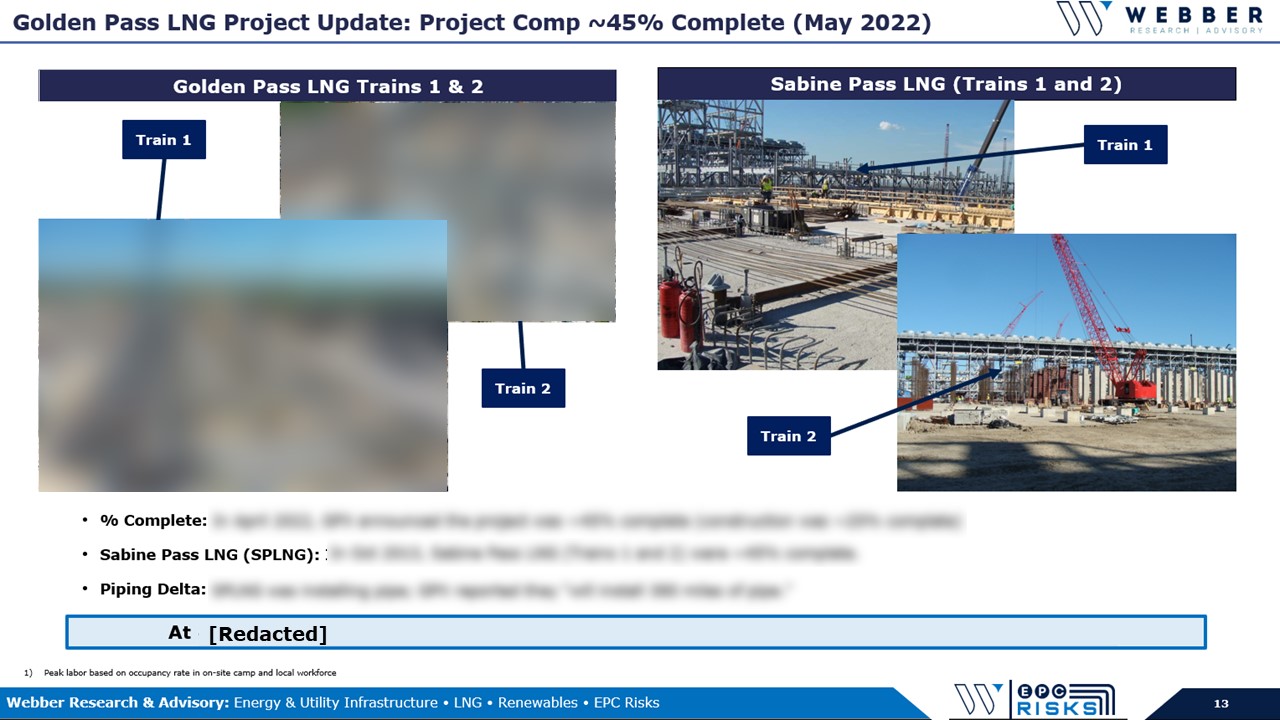
4) Sabine Pass Comparison. 18-Months after FID Sabine Pass LNG Trains 1 & 2 were 57.1% complete, vs our estimated range for Golden Pass LNG (~10-16%). (Page 8)
Golden Pass LNG Satellite Image Overview (page 13)
W|EPC: LNG Canada Q320 Monitor – Labor Dynamics & Baseline Satellite Image Review
Total Pages: 17
Table Of Contents
- LNG Canada Q3 Monitor: Key Takeaways
- Union Labor Agreements
- Contract Analysis & Estimates
- On-Site Construction Progress
- Awarded Construction Contracts
- Future Construction Contracts
- Labor Availability
- Project Estimates
- Satellite Image Analysis
- Baseline Site Satellite Image Overview
- Marine Terminals
- LNG Process Area
- LNG Storage Tanks
- Disclosures
Key Takeaways:
1) Union Craft Avg. Wage Rate Escalators & Impact On JGC/Fluor, and broader project cost…
What’s Happened/Changed: Part of our current focus is on LNG Canada’s wage rate escalation and union labor agreements post-2023.
Why Does That Matter: EPC lump sum proposals generally include labor escalation between 1-3% per annum (rates vary based on geography/availability). Labor agreements supporting LNG Canada and other B.C. projects expire in 2023 and have a relatively advantageous average labor escalation rate of…..continued.
For context, union labor strikes, renegotiated agreements, and significant wage rate escalation supported Gorgon LNG coming in $20B+ over budget.
What’s The Impact:…..continued (Page 3)
2) Taking A Look At JFJV’s Longer-Term Labor Inflation Risk (Page 5)
3) JFJV’s Construction Activity – What does it tell us about the project timeline? (Page 8)
4) Satellite Image Analysis Baseline – Benchmarks for Remainder of the Project…. (Pages 9-17)

Venture Global & The Approaching Nexus – Drone & Satellite Image Analysis, Engineering Changes – Q320
Total Pages: 27
Table Of Contents
- Calcasieu Pass Update – Key Takeaways
- Calcasieu Pass – Module Overview
- Importance Of The Notification Window
- Engineering Changes: Pre-Treatment Modules
- Engineering Changes: Liquefaction Modules
- Technical Analysis: Changes & Impact?
- Satellite Image Analysis – BH Module Yard
- Drone Image Analysis – Site Prep Update
- Remaining Questions
- Scenario Analysis & Predictions
- Disclosures
Key Takeaways:
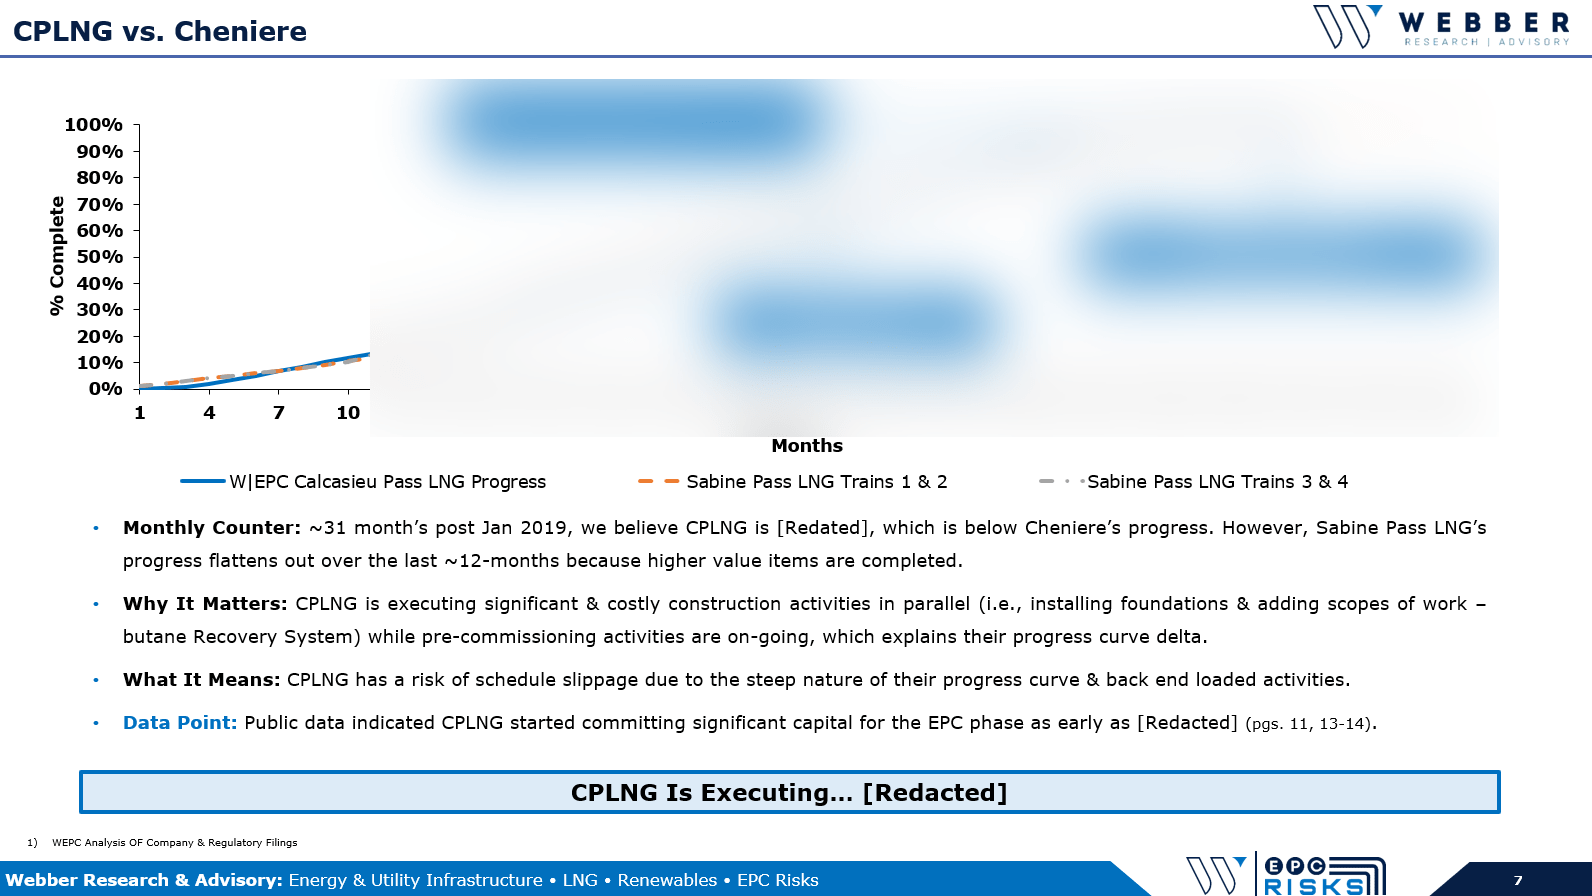
1) We believe there’s a path to success (and underestimating Venture Global has been generally been a dangerous proposition) – however the late-stage engineering changes create a risk that’s worth watching.
2) Directly or indirectly, we believe the ultimate resolution to Calcasieu Pass will impact several aspects of the LNG supply chain – including competing projects, technology providers, and EPC partners. (page 22)
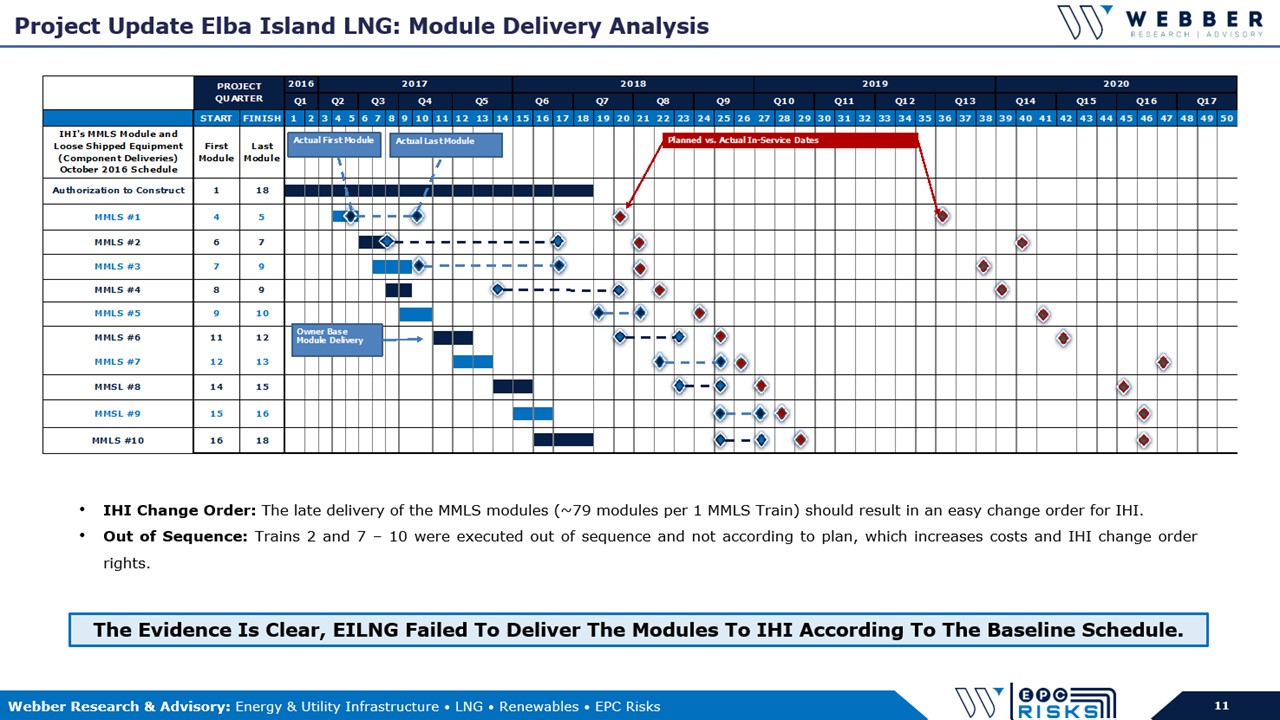
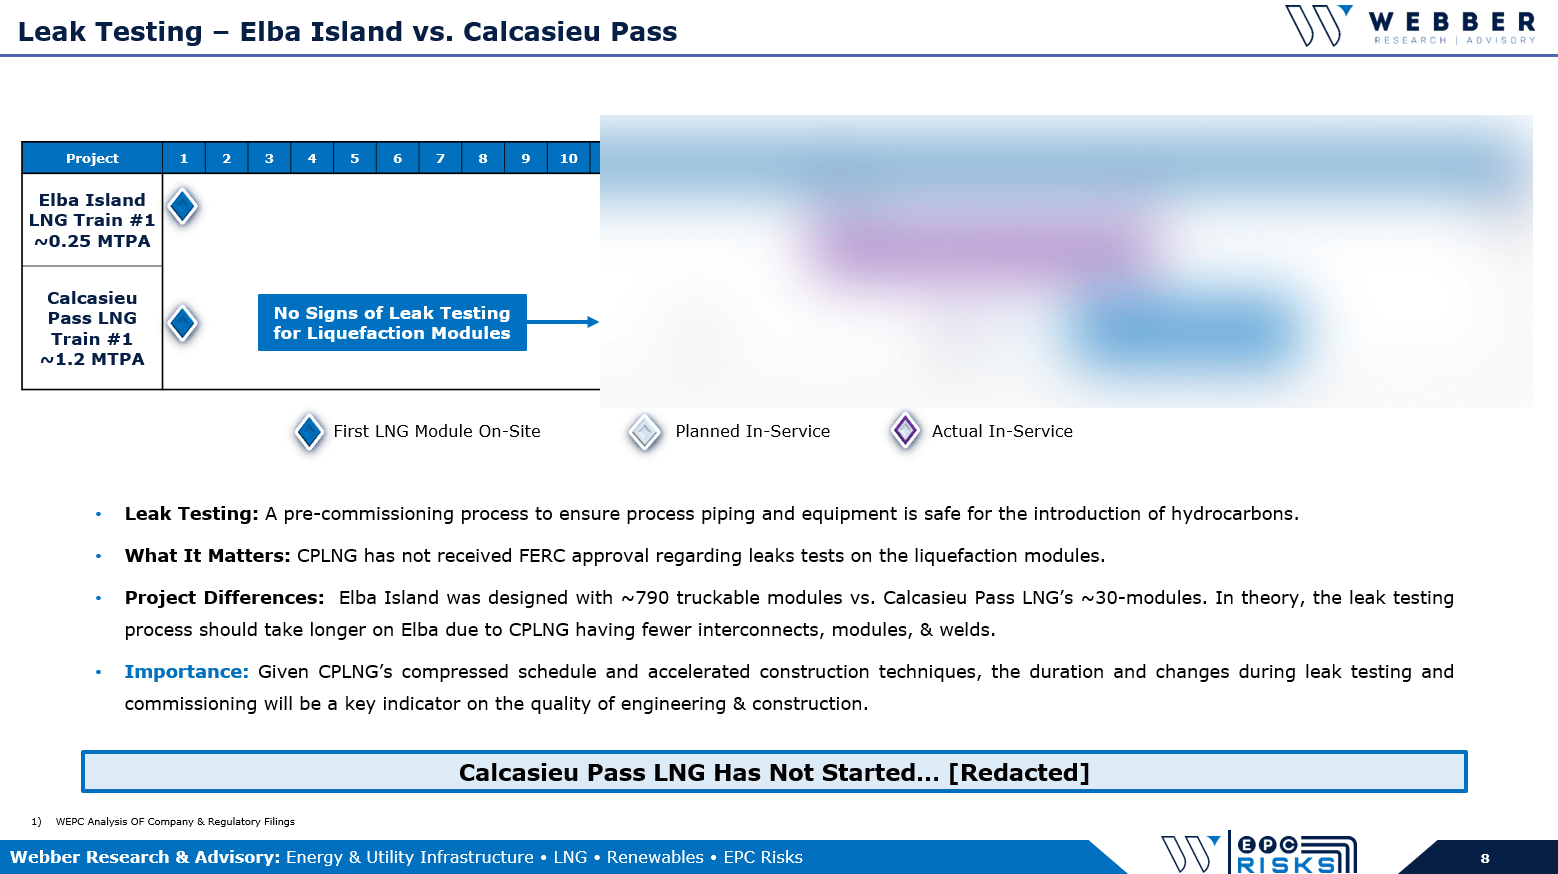
3) Module Delivery Sequencing Is Important. For context, KMI/Elba Island provided liquefaction modules to their EPC contractor (IHI E&C) 11-months late, which contributed to claims & >$300MM in forecasted change orders.
4) BKR’s Module Fabrication. Satellite images suggest Baker Hughes is installing….. (pages 14-17)