 client log-in

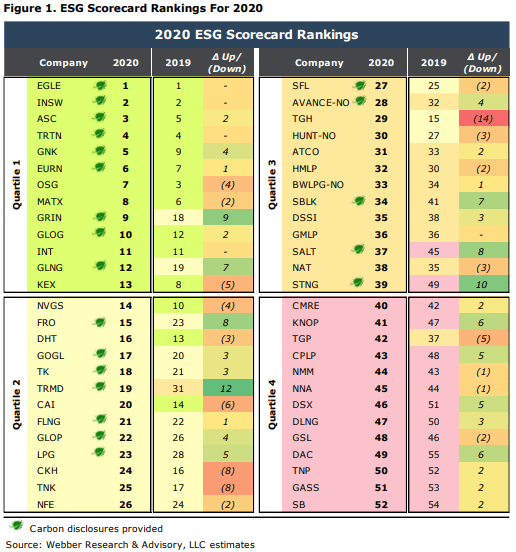
Webber Research ESG Scorecard: 2020
2020 ESG Scorecard – Updated Model, Same Idea. Before we delve into our updated rankings, framework, and company specific changes, we want to reiterate the idea that underpins this entire endeavor, which is that we believe there is no longer a place in the public shipping markets for companies that do not prioritize strong corporate governance and capital stewardship. We believe that risk premiums associated with poor governance and capital discipline should continue to widen, eventually pricing-out conflicted players and antiquated structures from public markets.
New Carbon Factor. Our 2020 ESG Scorecard includes a broadened methodology that incorporates the public disclosure of relevant of carbon data, which becomes the 9th factor within our proprietary multi-factor ESG model and increases the total number of subfactors to 20 (from 18). The carbon disclosure metrics we’ve chosen to initially include (AER & EEOI – see Page 15) are aimed at aligning our ESG framework with the Poseidon Principles, and intended to help facilitate the consistency and disclosure of carbon data to investors. We will also continue to display each company’s ESG Scorecard Quartile, as well as a Carbon Disclosure Indicator on the front page of our company-specific research notes – as we’ve done since we launched Webber Research in Q419.
Model Adjustments. We’ve given our new Carbon Factor a 20% weighting within our model, positioning it among the most dominant variables within our framework, while re-weighting other aspects of our model in order to accommodate the addition. Our revised factor weightings and methodology can be found on Pages 10-15. We also narrowed our 2020 ESG Scorecard universe to 52 companies from 56 (Page 5).
Carbon Disclosure: Who’s Participating? We’ve included a summary of our work around carbon disclosures on Pages 2-3. In total, 42% of the companies in our scorecard (22/52) met carbon disclosure requirements within our model. While we’re encouraged by the level of initial participation, there’s clearly room improvement. To that point, we’re aware of several companies still the process of aggregating, auditing, and (eventually) disclosing relevant carbon data to investors, which should continue to improve the participation level in subsequent scorecards.
Superior Governance Translates To Outperformance:
• Companies with the strongest ESG scores (EGLE, INSW, ASC, TRTN, GNK, EURN, OSG, MATX, GRIN, GLOG, INT, GLNG, and KEX) outperformed the group by 16% on a 5-year basis and 41% since inception.
• Companies with the weakest ESG scores (CMRE, KNOP, TGP, CPLP, NMM, NNA, DSX, DLNG, GSL, DAC, TNP, GASS, and SB) underperformed the group by (24%) on a 3-year basis and (25%) since inception.