 client log-in

Webber Research & Advisory Continues Platform Expansion with Additions in Carbon Capture and Hydrogen Midstream
Read More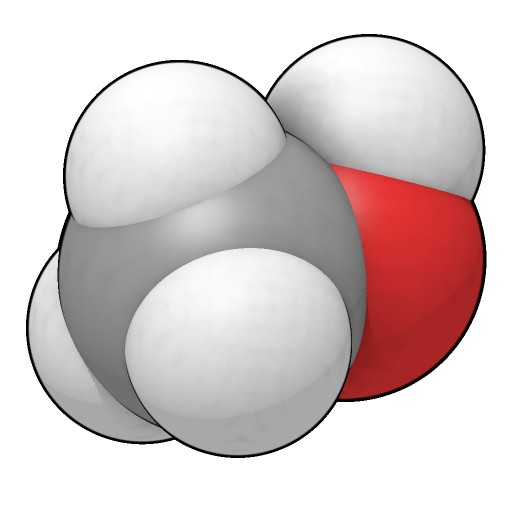
W|EPC: Renewable Methanol & Hydrogen – Analyzing Methanex’s (MEOH) Geismar Facilities
Renewable Methanol & Hydrogen – Analyzing Methanex’s (MEOH) Geismar Facilities – September 2020
- Methanex & Renewable Methanol – Key Takeaways (page 2)
- Renewable Methanol (page 3)
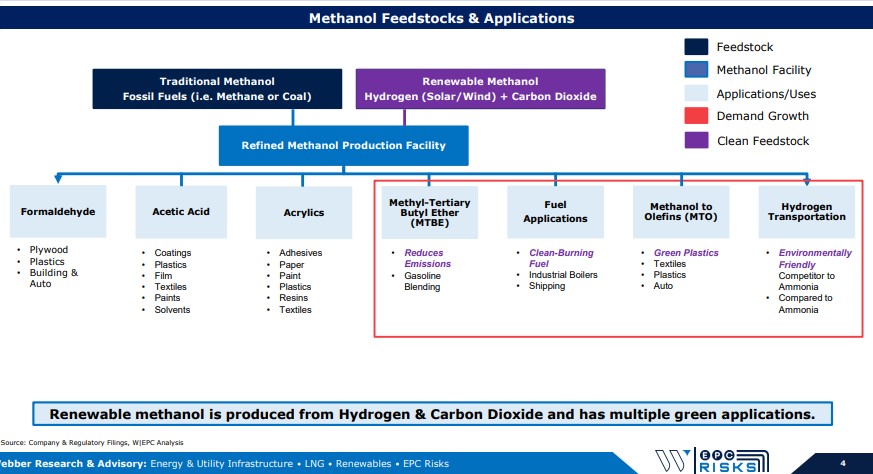
- Methanol Feedstock & Applications (page 4)
- Hydrogen is Getting Cheaper (page 5)
- Renewable Methanol Facilities (page 6)
- Geismar Methanol Facilities (page 7)
- Methanex Overview (page 8)
- History – Geismar Units 1 & 2 (page 9)
- Geismar Unit 3 Comps (page 10)
- GU3 Cost Overview (page 11)
- Schedule – Key Milestones & Impact (page 12)
- Monthly Progress Curves (page 13)
- EPC Dynamics – So Long KBR, Next Up?(page 14)
- Disclosures (page 15)
Lower-Cost Hydrogen Will Produce Cost Competitive Renewable Methanol: Pipe Dream or Reality? Global methanol demand sits near ~75 MTPA; with demand expected to ramp amid new EU and U.S. environmental mandates. Renewable Methanol (RM) is produced using Hydrogen (H2) from solar/wind and carbon dioxide (CO2) as compared to traditional methanol produced from fossil fuels (i.e. coal & natural gas). (Page 4)
Cost-competitive RM would open the door to green plastics and support various marine, fuel, & vehicle clean energy mandates but, costs are not competitive based on current technology. (Pages 4 – 5) Limited project economics hasn’t stopped ~10 commercial scale renewable methanol facilities in various stages of development around the world. As these projects develop, lower costs and improved technology would be a game changer for the methanol industry while providing H2 more downstream applications. (Page 6)
Tracking the 800 lbs. Methanol Gorilla…Methanex (MEOH). (Pages 8 – 9)
Geismar Unit 3 – Positioning vs. Competition. (Pages 10 – 13)
For access information, please email us at [email protected] or visit us at webberresearch.com
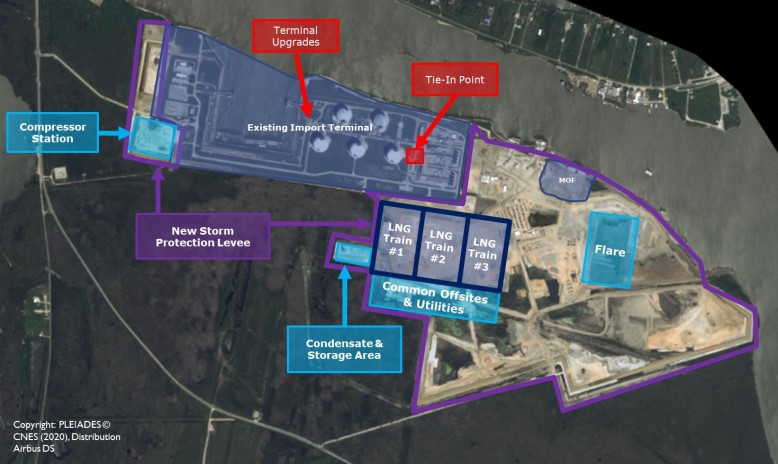
W|EPC: Golden Pass LNG (XOM, QP) – Project Update & On-Site Satellite Image Analysis – Q320
Golden Pass LNG: Our Delay & Contingency Fund Estimates Continue to Ramp
Key Takeaways:
• Chiyoda’s Engineering Delays Continue. We believe engineering delays have eroded a significant portion of the EPC risk, contingency, and profit, with the likelihood of ramping balance sheet exposure. (Pages 4 & 11)
• Our updated project timeline (delay) and contingency fund estimates are now material, sitting at….(continued)
• Our estimates point to Golden Pass project progress sitting closer to ~10% vs Chyioda’s report figure of 16% (Q2) based on both our satellite image review and….(continued)
• Sabine Pass Comparison. 18-Months after FID Sabine Pass LNG Trains 1 & 2 were 57.1% complete, vs our estimated range for Golden Pass LNG (~10-16%). (Page 8)
Table Of Contents
- Golden Pass Q320 Update – Key Takeaways (page 2)
- Revised Cost & Schedule Forecasts (page 3)
- Cost Forecast (page 4)
- Project Milestones (page 5)
- Progress Analysis (page 6)
- Analysis – Chiyoda’s 16% Reported Progress (page 7)
- Putting It All Together – W|EPC Updated Contingency fund and project delay estimates
- 18-Months After FID, Sabine Pass vs. Golden Pass LNG (page 8)
- Joint Venture Analysis (page 9)
- Change Order Analysis vs. JV Structure (page 10)
- Possible Impacts to Chiyoda (page 11)
- Satellite Image Analysis (page 12)
- Disclosures (page 17)
Golden Pass LNG Satellite Image Overview (page 13)
For access information please email us at [email protected]
W|EPC: Golden Pass LNG – Delay & Contingency Fund Estimates Continue To Ramp – Updated Project & Satellite Image ReviewRead More

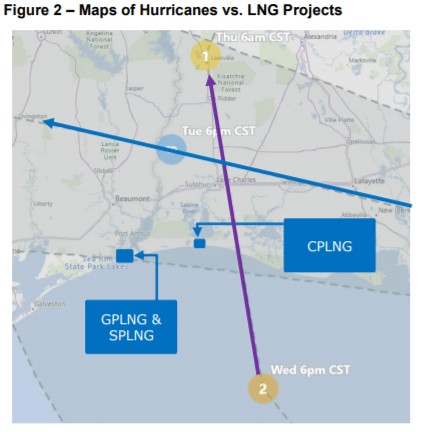
W|EPC: Assessing Force Majeure Impact on Calcasieu (Venture Global), Golden Pass (Exxon, QP) & Sabine (Cheniere)
Webber Research – Energy EPC
Marco & Laura Impact Could Last 7 to 14 Days…Depending on Damage & Craft Labor Retention
EPC contractors receive schedule relief for Force Majeure (FM) events (i.e. named storms such as Marco & Laura) in industry standard EPC contracts, which typically provides EPC contractors schedule relief but not cost relief.
EPC contractor FM claims on Calcasieu Pass, Golden Pass, and Sabine Pass LNG likely started yesterday August 24th, 2020 (due to mandatory evacuations & closures).
Something to watch…construction workers tend to scatter and chase higher paying (wages & per-diem) jobs post hurricanes/natural disasters, which creates headaches for on-going/planned projects and complicates FM claims.
Based on current Marco & Laura forecasts and expected rain/storm surge, we are forecasting a 7 to 14-day construction schedule delay on Calcasieu Pass LNG (CPLNG), Golden Pass LNG, & Sabine Pass LNG Train #6 (SPLNG6).
Impact & Timeline Implications
Often, impacts due to hurricanes occur well beyond the actual storm itself due to lost productivity and challenges restarting/staffing the project.
Flooding – enough drainage pumps installed and site drainage working sufficient to mitigate additional rain fall.
Storm Surge – levees/walls high enough to protect rising levels and all equipment moved to the highest elevation on the site (if practical).
Wind – cranes must be placed horizontally and structures secured to reduce/prevent damage.
Temporary Construction Facilities – if levees and/or drainage are not in place at temporary construction facilities, equipment and material stored in laydown yards/facilities could be damaged by water and cause unplanned long-term issues.
EPC contractors have a reputation for trying to use FM impacts to absorb existing self-inflicted schedule delays. Based on the current/expected forecast, we believe the following FM timeline is realistic.
Prep time for storms – 1 to 3 days
Marco & Laura storm duration – 2 to 4 days
Restart & productivity losses – 4 to 7 days
Our specific estimates and thoughts on individual projects in the pages that follow:
For subscription information, email us at [email protected]. For more information on this note, please visit our online store at webberresearch.com/downloads
Read More
W|EPC: Gorgon LNG – Operational Breakdown Could Have Contributed To Kettle Cracks – Mid-October A More Likely Restart Timeline
W|EPC: Gorgon LNG – Operational Breakdown Could Have Contributed To Kettle Cracks
Mid-October May Be A More Likely Restart Timeline
Key Takeaways:
Pump The Brakes: While potential fabrication errors have been the primary narrative around the Propane Kettle cracks that shut down Gorgon LNG, it’s feasible that operational issues (and one in particular) may have contributed or even partially caused the cracks on Train-2’s kettles, which could have significant and more complex implications.
- The propane kettle cracks were noticed ~3-years after the kettles were placed in-service (likely beyond any warranty period), potentially shifting costs to Chevron.
- According to our in-house engineers, a breakdown in the propane vapor transfer step could subject the propane kettles to temperatures significantly below the minimum design metal temperature; creating stress on the metal and an optimum environment to cause cracks.
- If the root cause involved an operational issue, it would require not just replacement or repairs, but more robust inspections, testing, and training, which would add to the out-of-service timeline (below).
- If a breakdown in the propane vapor transfer step did contribute to the cracks, it would have likely needed to be repeated routinely to cause the visible cracks on Train-2, increasing the likelihood that such an error would have been repeated on Trains 1 and 3 as well, given the likelihood of crew rotation.
Timeline Implications
According to recent press reports, Chevron has suggested an early September restart for Train 2 and provided train 1 & 3 inspection time-frames.
- Train 2 – Currently Down since July, Online Sep 20
- Train 1 – Shutdown Early Oct 20, Online Nov 20 to Jan 21
- Train 3 – Shutdown Jan 21, Online Mar 21 to Apr 21
- We think mid-October for Train 2 may be more realistic. While the repairs themselves may fit within a mid-September target, we believe a thorough assessment of the route problems, inspections, training, etc., likely push out the downtime. We don’t know yet what approvals and 3rd party reviews will be necessary to confirm the repairs were made in a satisfactory way, but this could impact the timelines given as well. Continued…
For access information please email us at [email protected]
Read More