W|EPC: Assessing Force Majeure Impact on Calcasieu (Venture Global), Golden Pass (Exxon, QP) & Sabine (Cheniere)
Webber Research – Energy EPC
Marco & Laura Impact Could Last 7 to 14 Days…Depending on Damage & Craft Labor Retention
EPC contractors receive schedule relief for Force Majeure (FM) events (i.e. named storms such as Marco & Laura) in industry standard EPC contracts, which typically provides EPC contractors schedule relief but not cost relief.
EPC contractor FM claims on Calcasieu Pass, Golden Pass, and Sabine Pass LNG likely started yesterday August 24th, 2020 (due to mandatory evacuations & closures).
Something to watch…construction workers tend to scatter and chase higher paying (wages & per-diem) jobs post hurricanes/natural disasters, which creates headaches for on-going/planned projects and complicates FM claims.
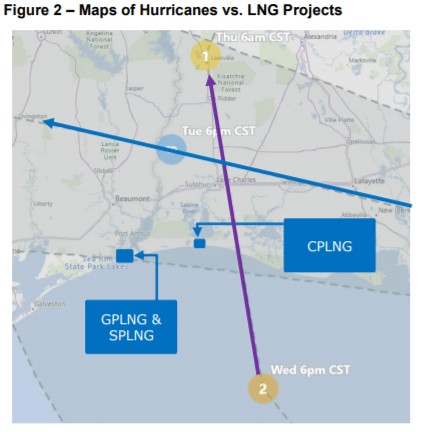
Based on current Marco & Laura forecasts and expected rain/storm surge, we are forecasting a 7 to 14-day construction schedule delay on Calcasieu Pass LNG (CPLNG), Golden Pass LNG, & Sabine Pass LNG Train #6 (SPLNG6).
Impact & Timeline Implications
Often, impacts due to hurricanes occur well beyond the actual storm itself due to lost productivity and challenges restarting/staffing the project.
Flooding – enough drainage pumps installed and site drainage working sufficient to mitigate additional rain fall.
Storm Surge – levees/walls high enough to protect rising levels and all equipment moved to the highest elevation on the site (if practical).
Wind – cranes must be placed horizontally and structures secured to reduce/prevent damage.
Temporary Construction Facilities – if levees and/or drainage are not in place at temporary construction facilities, equipment and material stored in laydown yards/facilities could be damaged by water and cause unplanned long-term issues.
EPC contractors have a reputation for trying to use FM impacts to absorb existing self-inflicted schedule delays. Based on the current/expected forecast, we believe the following FM timeline is realistic.
Prep time for storms – 1 to 3 days
Marco & Laura storm duration – 2 to 4 days
Restart & productivity losses – 4 to 7 days
Our specific estimates and thoughts on individual projects in the pages that follow:
For subscription information, email us at [email protected]. For more information on this note, please visit our online store at webberresearch.com/downloads
Read More
 client log-in