Total Pages: 30
Table Of Contents
- Key Takeaways And Flow Of H2 & CO2 – Page 2
Hydrogen’s Upstream
- Electrolysis Technologies & Market Leaders – Page 6
- Blue Hydrogen CO2 Issue – Page 7
- Hydrogen Is Getting Cheaper – Page 8
- Carbon Capture Systems & CO2’s Critical Role – Page 9
Hydrogen’s Midstream – Transportation
- Ammonia Transportation – Green Hydrogen – Page 12
- Methanol Transportation – Blue & Green Hydrogen – Page 14
- Cryogenic Hydrogen Energy Loss Concern – Page 16
Closer Look – Ammonia vs Methanol
- Hydrogen Comparison – Page 18
- Example Product Comparison – Page 19
- Converting Back To H2 – Page 20
- Ammonia & Methanol Co-Production Facilities – Page 21
Marine and Fuel Cell Comps
- Industry Impact – H2 Transportation – Page 23
- IMO Driving LNG, Ammonia Or Methanol Fuel For Ships – Page 24
- Carbon Neutral Marine Fuels – IMO 2050 – Page 25
- Ammonia & Methanol Co-Production Facilities – Page 26
Technology Leaders and Applications
- H2 – Industry Technology Leaders – Page 28
- Applying Technology In The EPC Process – Page 29
- Technology Packaging & Trends – Page 30
Key Takeaways:
1) Upstream Sources Of Hydrogen – Blue & Green (Pages 4 – 9) : >95% of Hydrogen (H2) is produced using Steam Methane Reformer (SMR) technology that produces 7 units of CO2/unit of H2 (on average)
SMR w/ a carbon capture system (Blue H2) is the preferred option to environmentally manage excess CO2. (page 7)
Green H2 provides minimal CO2 but current technology limits Green H2’s cost competitiveness. (Page 6)
2) H2’s Sprint To Market Share… Current Leaders (Pages 17 – 21, 27 – 30) : We analyzed 13 Technology Companies spanning 12 Process industries, including ThyssenKrupp, Air Products, Air Liquide, & KBR/Johnson Matthey…the clear technology leaders include…
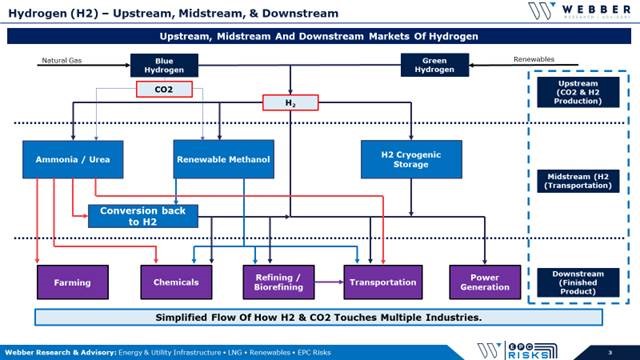
3) Frozen Industries – Marine, Automotive, & H2 Transport (Pages 22 – 26) : Outside factors (i.e. carbon neutral fuels, fuel cells, regulations, safety, & other downstream applications) will play a large role in selecting the midstream transportation choice for H2.
International Maritime Organization’s (IMO) mandates for reduced emissions has many ship builders looking at LNG, Ammonia, and/or Methanol; without a clear long-term winner (yet), many shipbuilders are frozen.
Fuel pumps (gas stations) must receive H2 from high-pressure storage vehicles, pipelines, or by converting Methanol or Ammonia to H2 at the fuel pump, with a number of implications.…(page 20)
4) Midstream For Hydrogen – H2 Transportation Options (Pages 10 – 16)
Ammonia, Methanol, and Cryogenic H2 are used to transport H2 long-distances.
Ammonia is the clear favorite to…
Methanol is the best option for…
Cryogenic H2 technology/costs…

 client log-in


