 client log-in
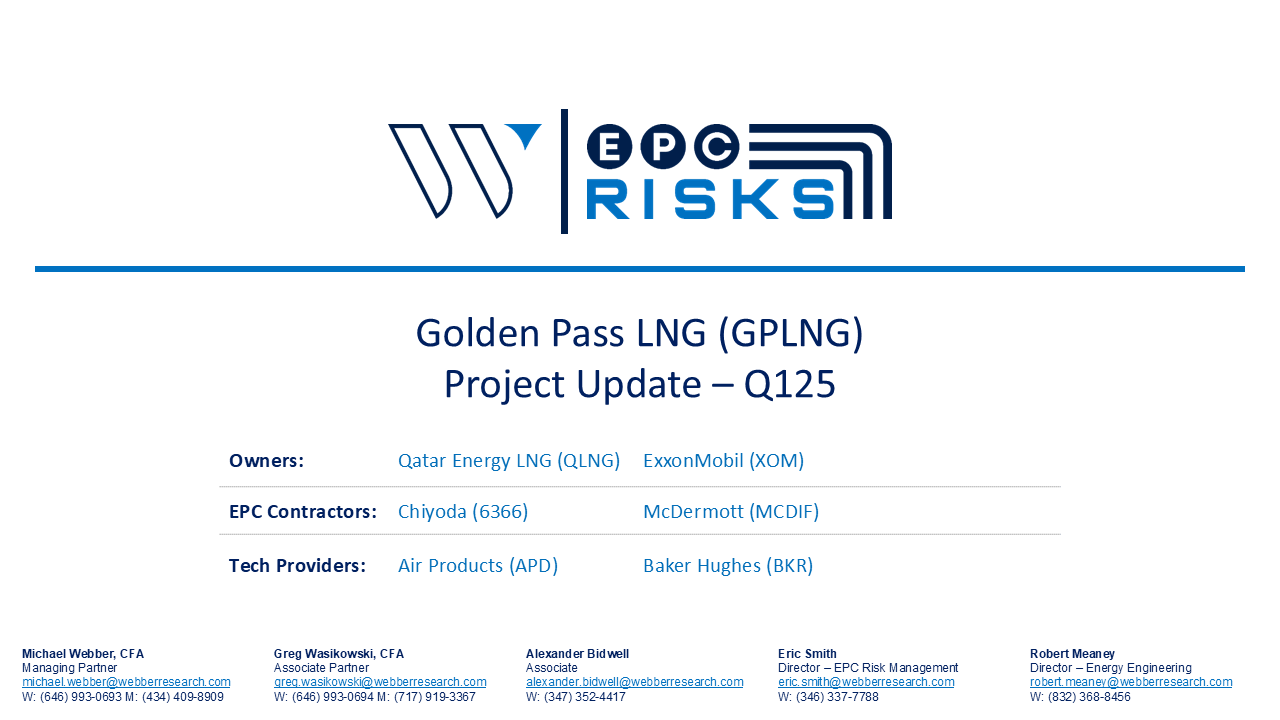


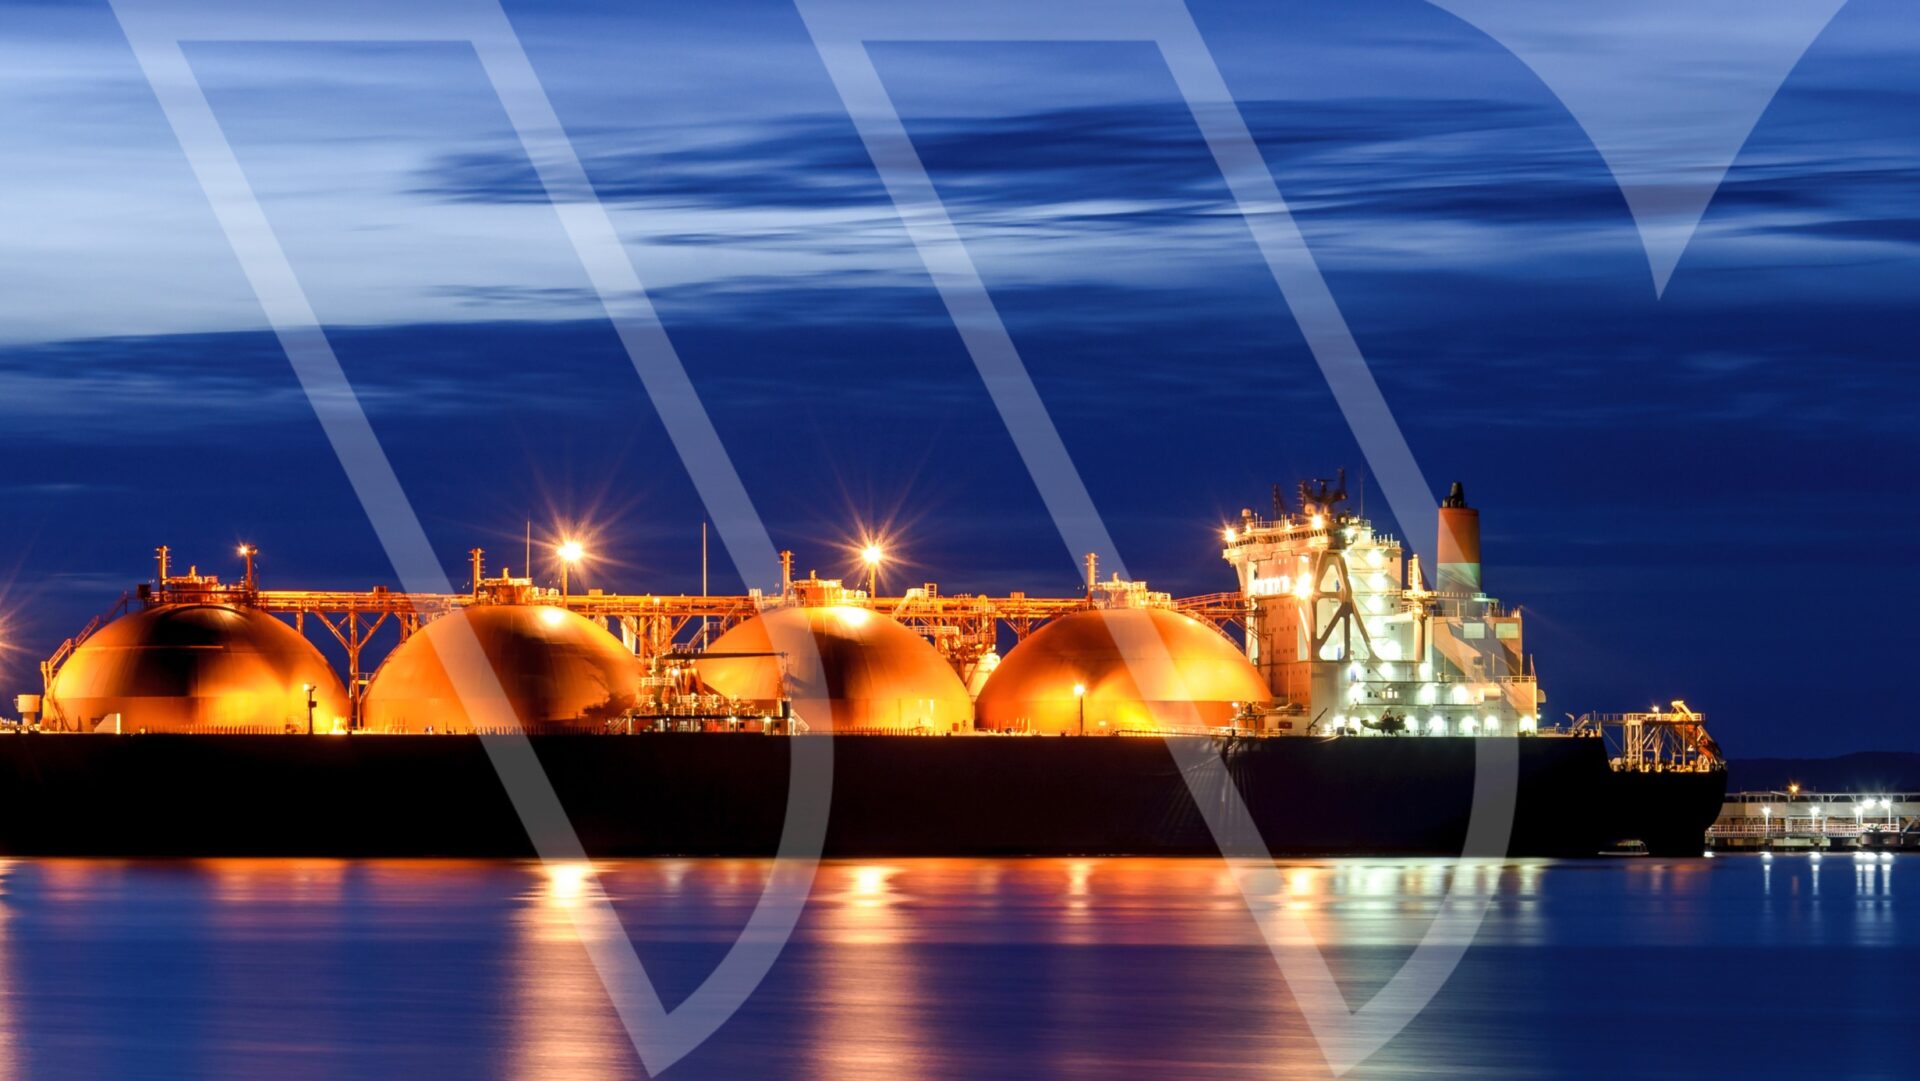

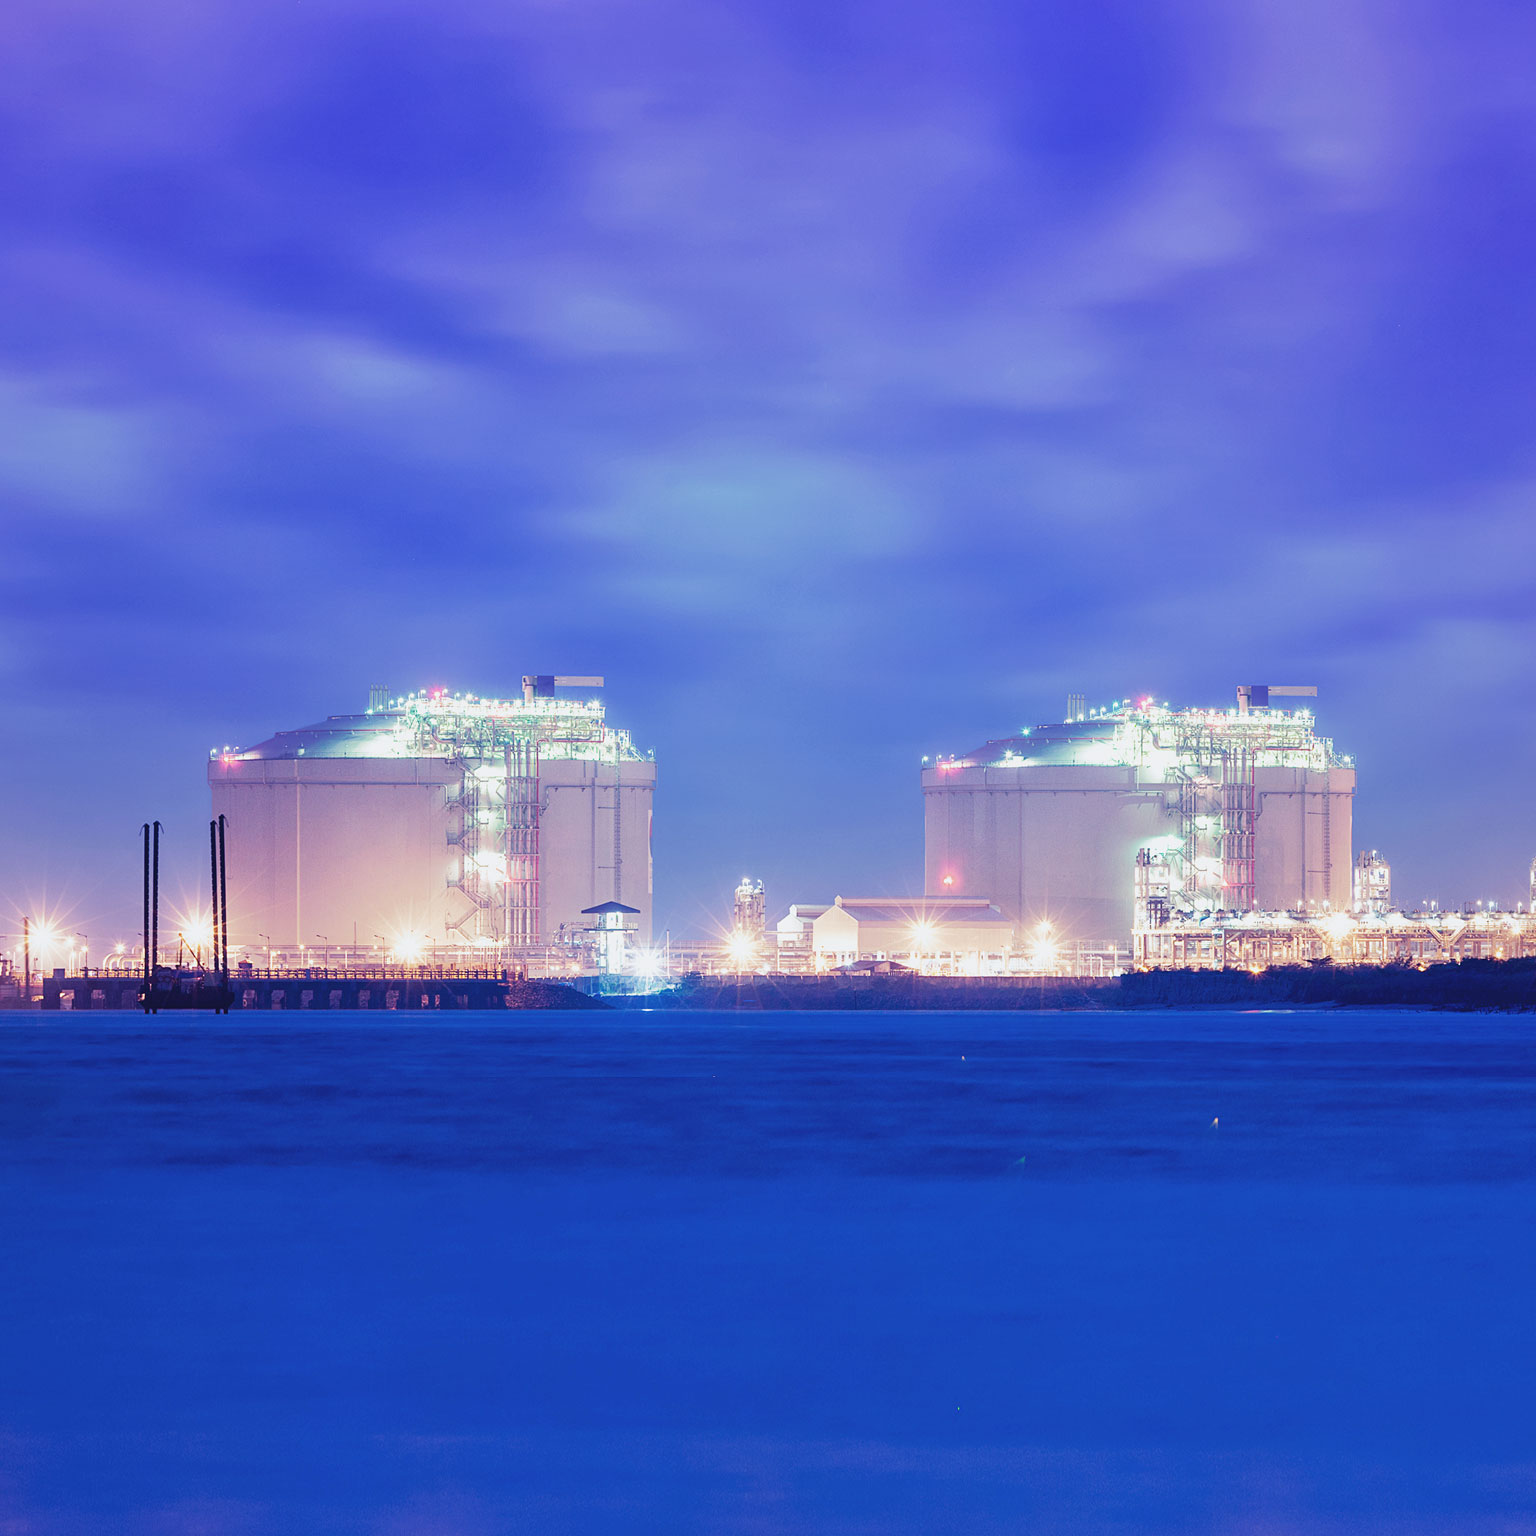
W|EPC: Golden Pass LNG – Delay & Contingency Fund Estimates Continue To Ramp – Updated Project & Satellite Image Review
Total Pages: 18
Table Of Contents
- Golden Pass Q320 Update – Key Takeaways (page 2)
- Revised Cost & Schedule Forecasts (page 3)
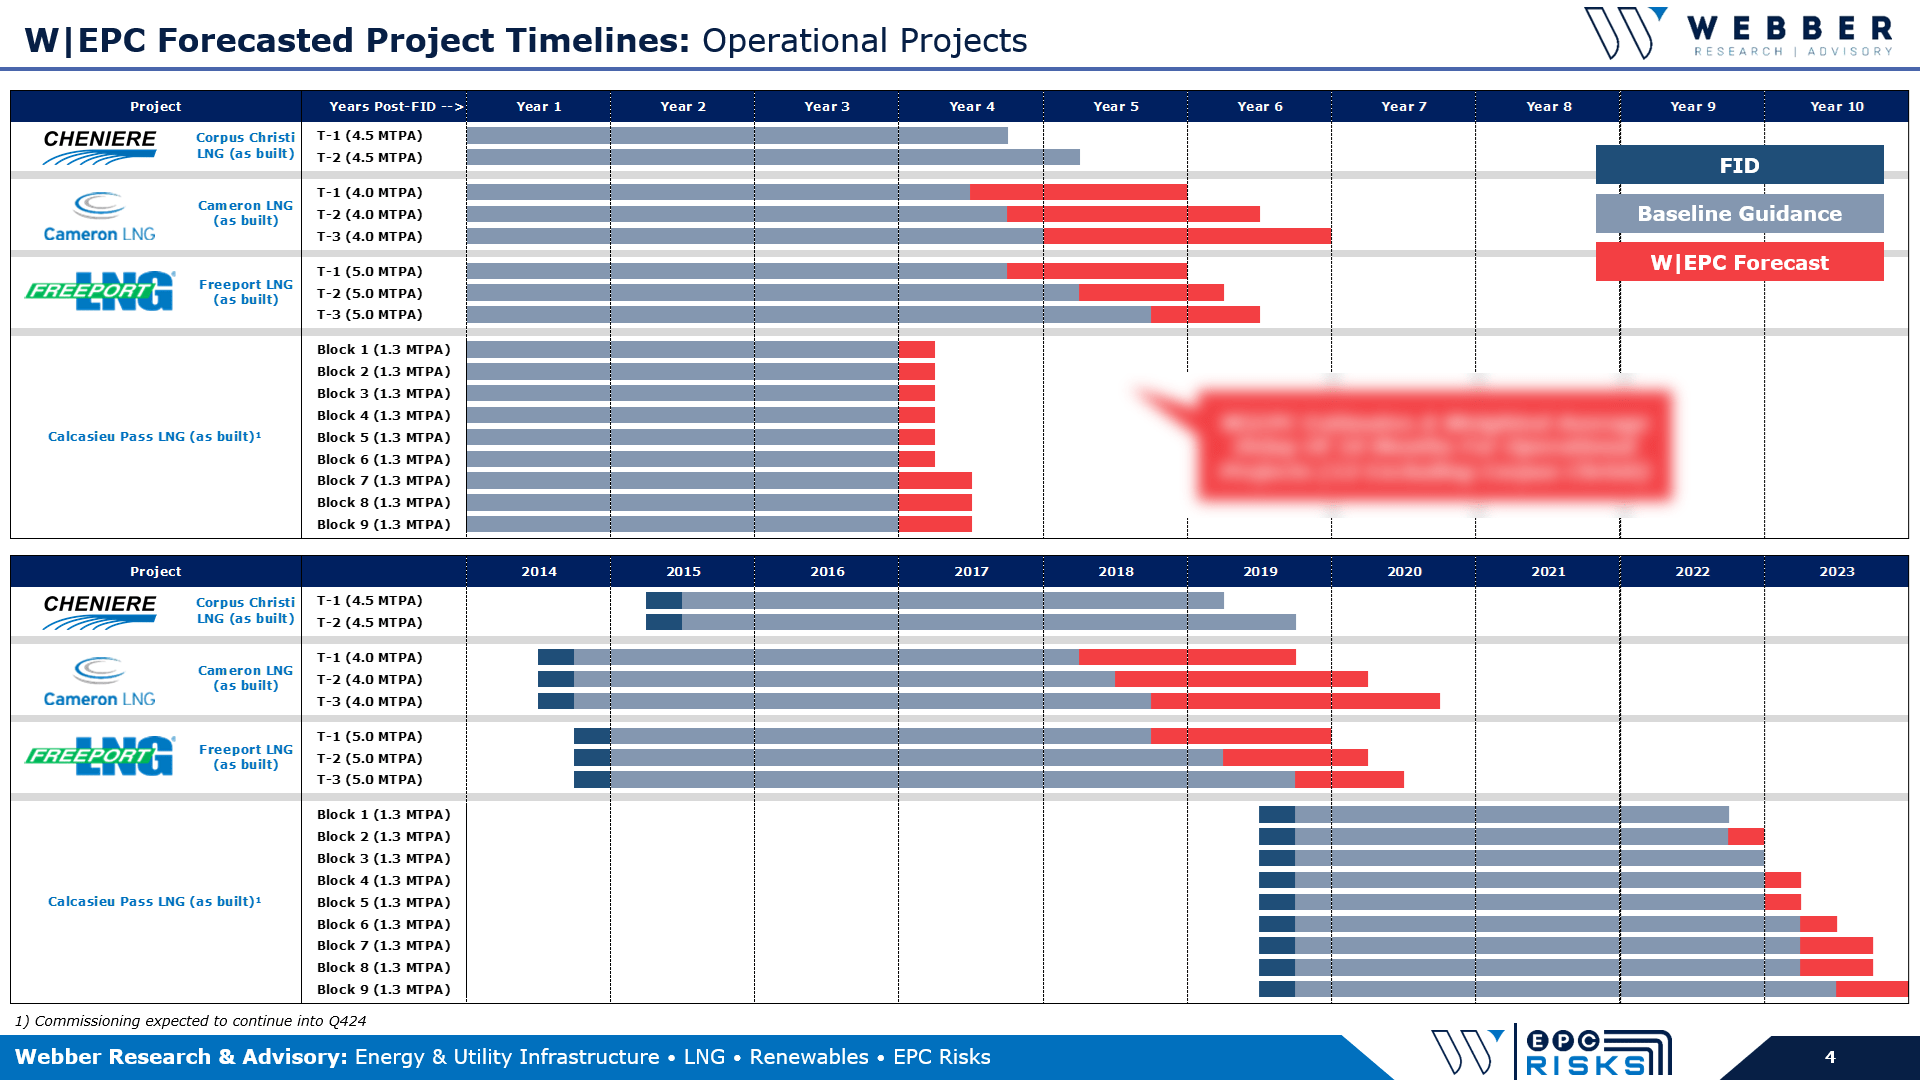
o Cost Forecast (page 4)
o Project Milestones (page 5)
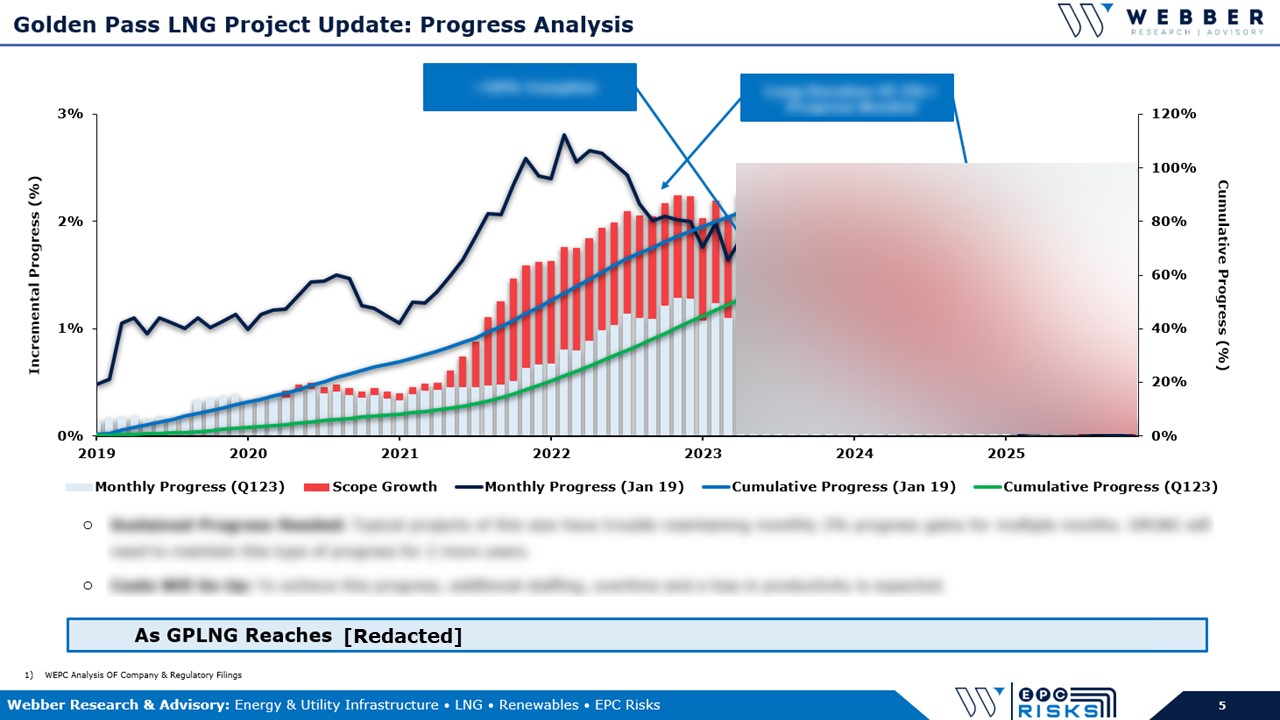
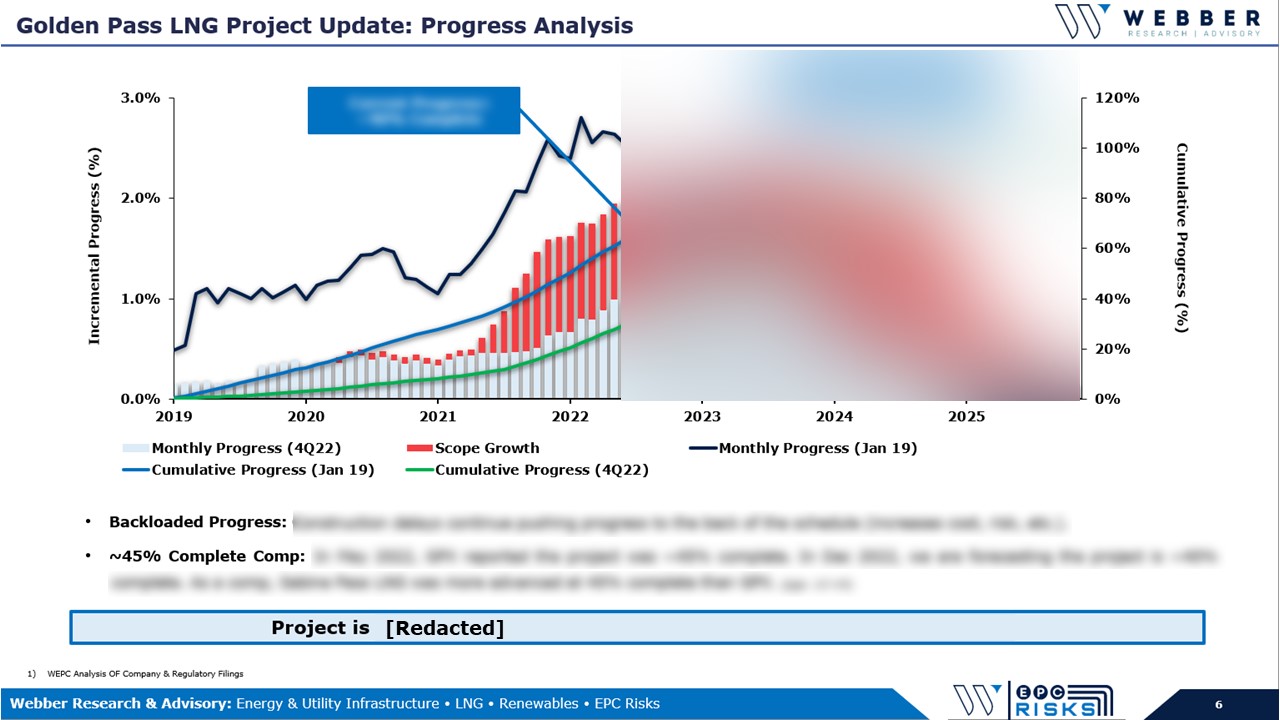
o Progress Analysis (page 6)
o Analysis – Chiyoda’s 16% Reported Progress (page 7)
o Putting It All Together – W|EPC updated contingency fund and project delay estimates
o 18-Months After FID, Sabine Pass vs. Golden Pass LNG (page 8) - Joint Venture Analysis (page 9)
o Change Order Analysis vs. JV Structure (page 10)
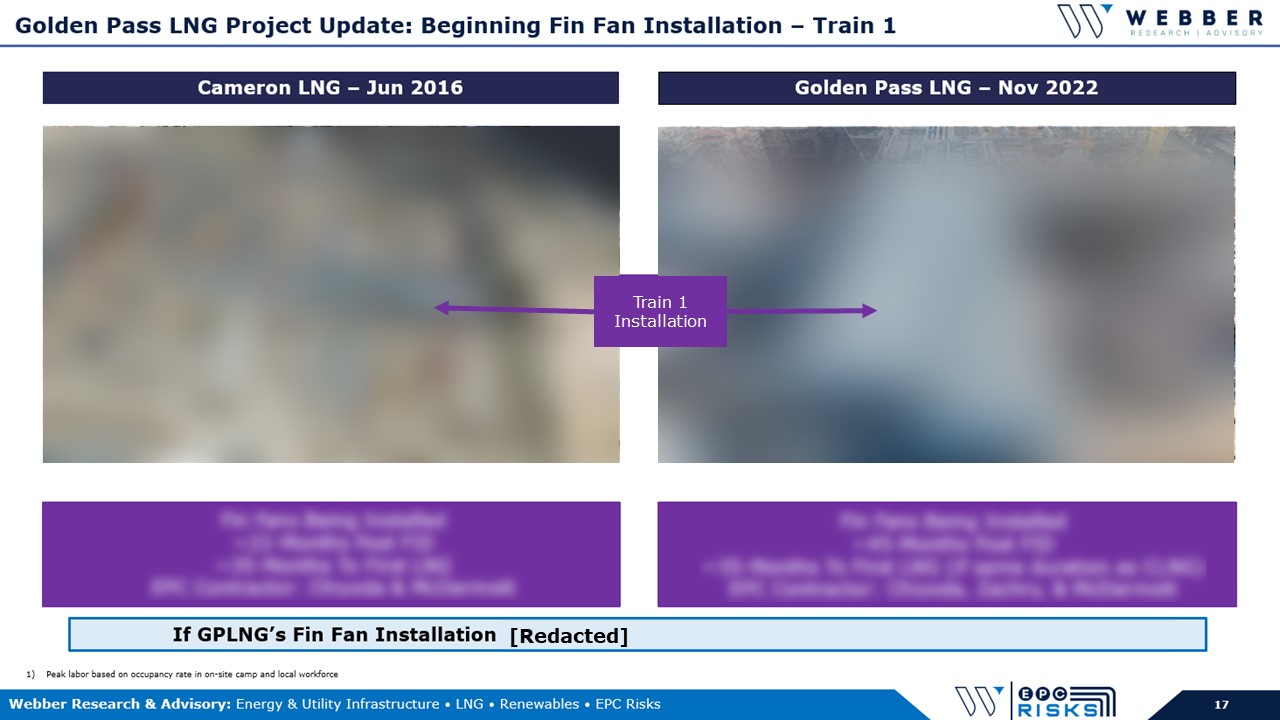
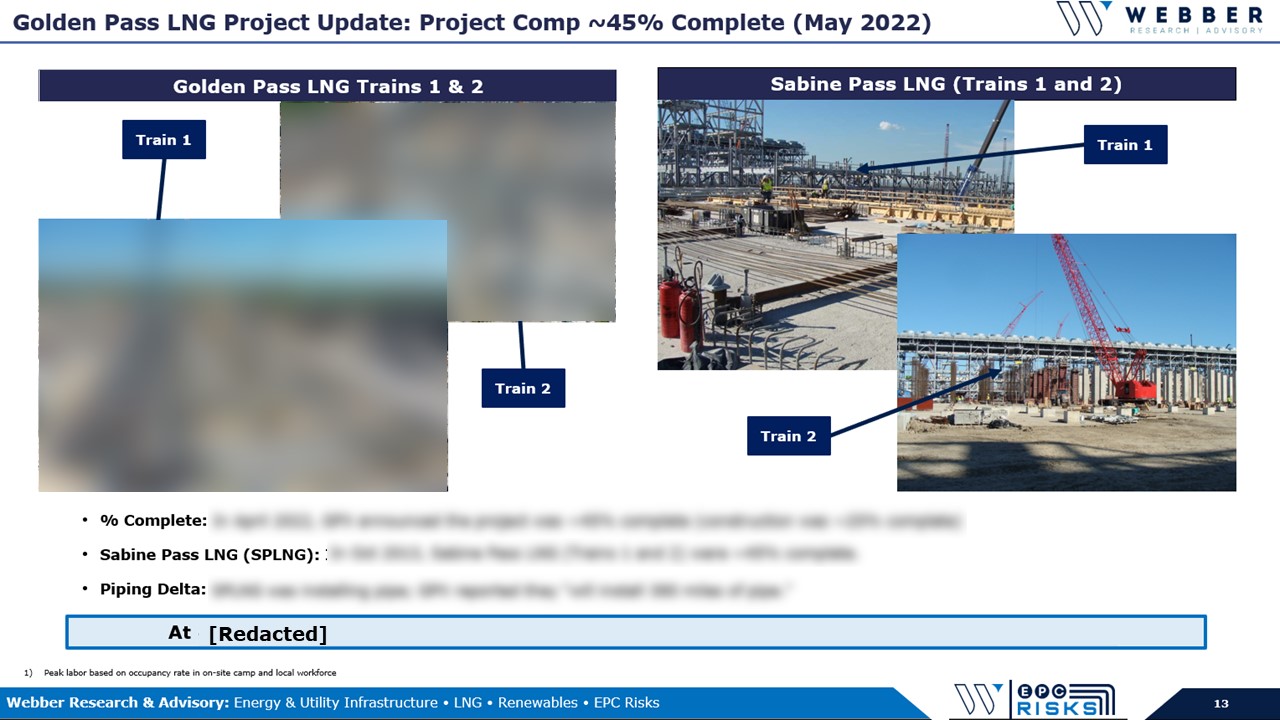
o Possible Impacts to Chiyoda (page 11) - Satellite Image Analysis (page 12)
- Disclosures (page 17)
Key Takeaways:
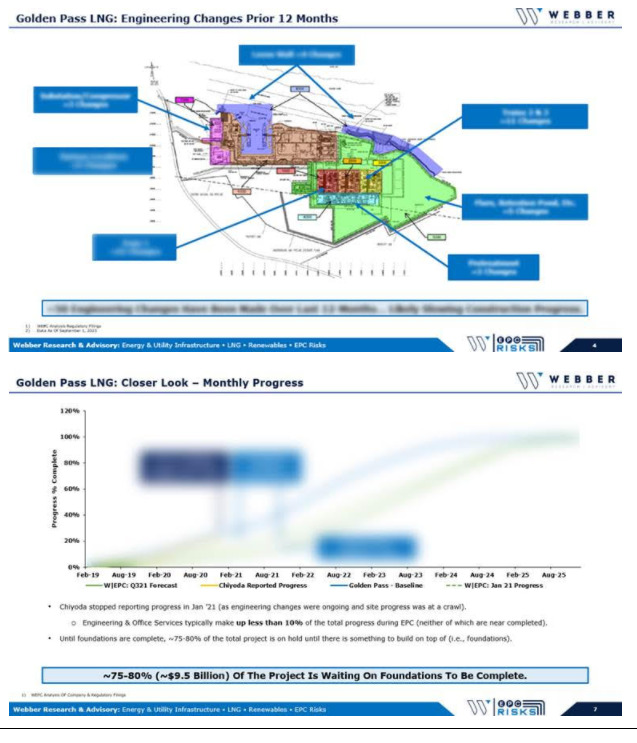
1) Chiyoda’s Engineering Delays Continue. We believe engineering delays have eroded a significant portion of the EPC risk, contingency, and profit, with the likelihood of ramping balance sheet exposure. (Pages 4 & 11)
2) Timeline & Cost Overrun Estimates. Our updated project timeline (delay) and contingency fund estimates are now material, sitting at….(continued)
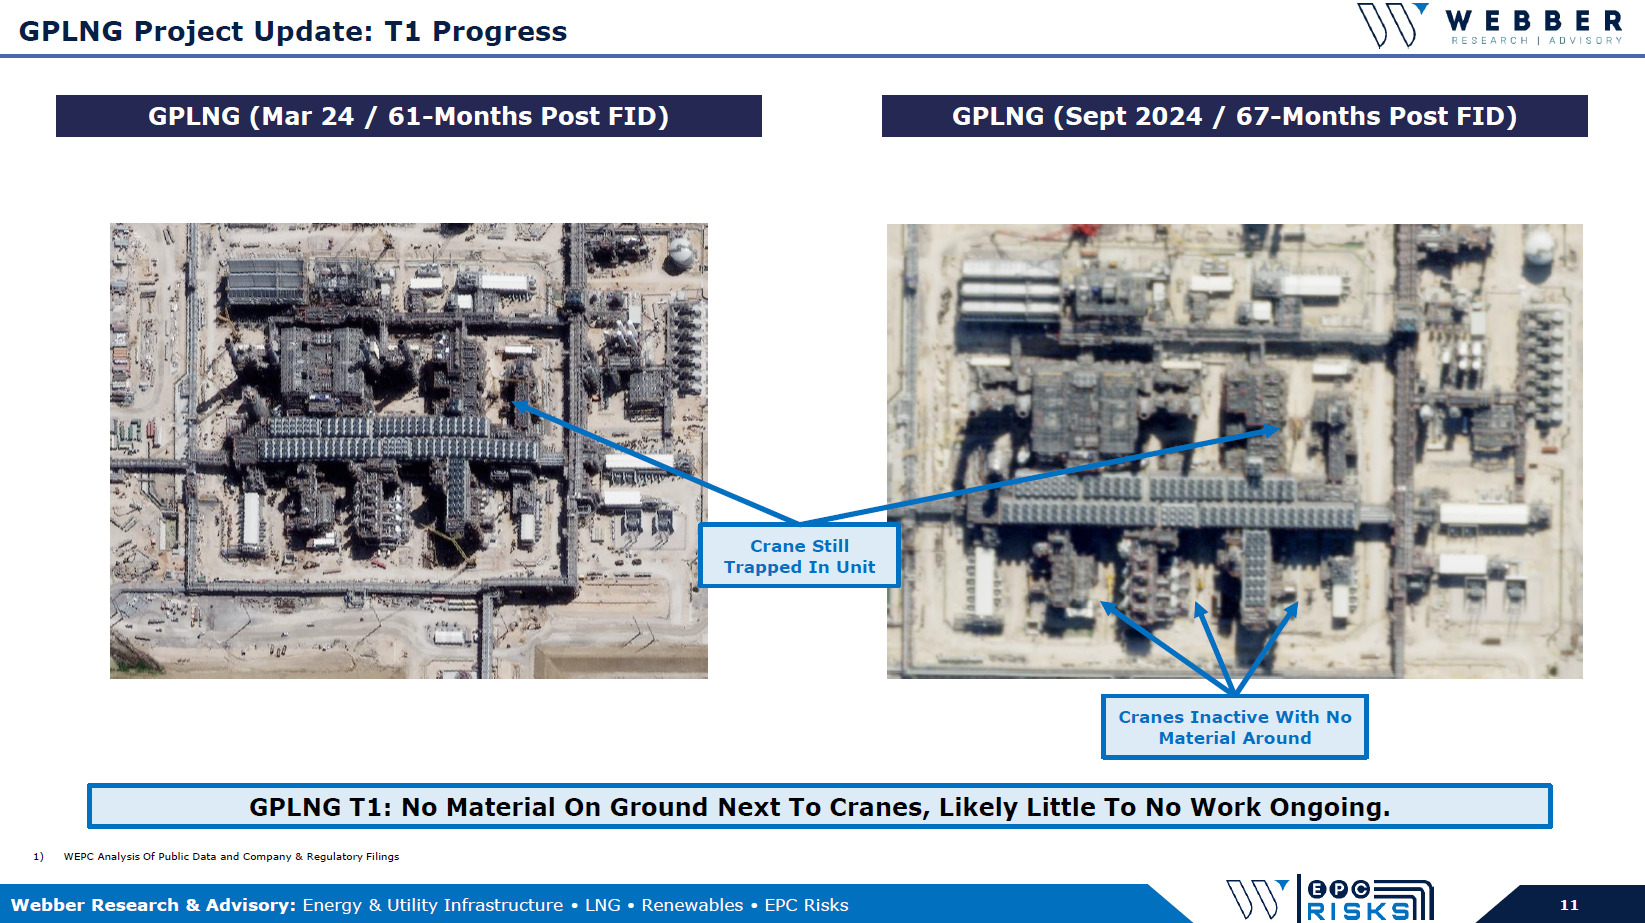
3) Our estimates point to Golden Pass project progress sitting closer to ~10% vs Chyioda’s report figure of 16% (Q2) based on both our satellite image review and….(continued)
4) Sabine Pass Comparison. 18-Months after FID Sabine Pass LNG Trains 1 & 2 were 57.1% complete, vs our estimated range for Golden Pass LNG (~10-16%). (Page 8)
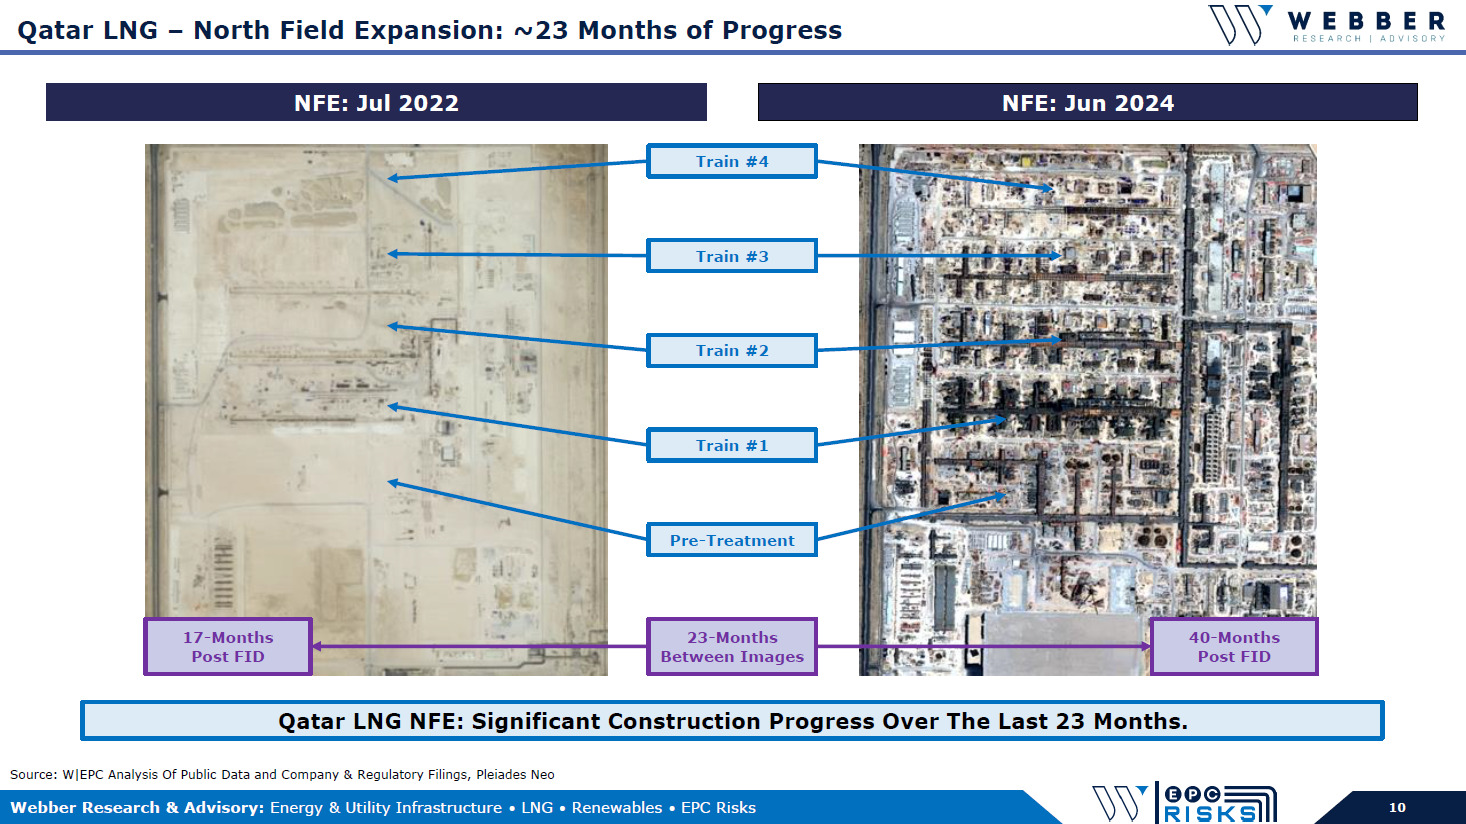
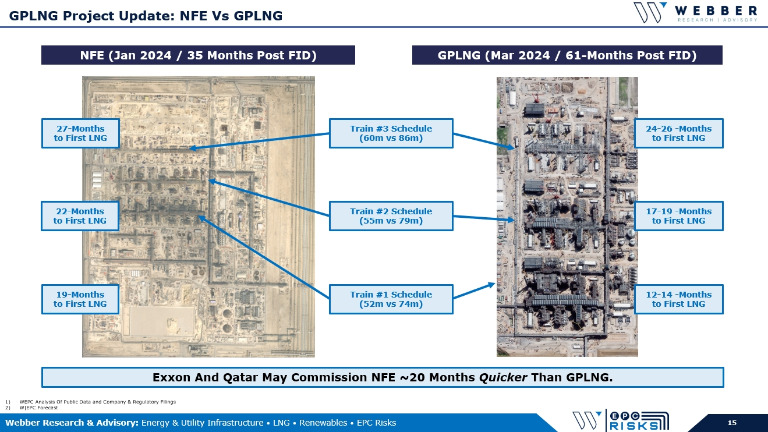
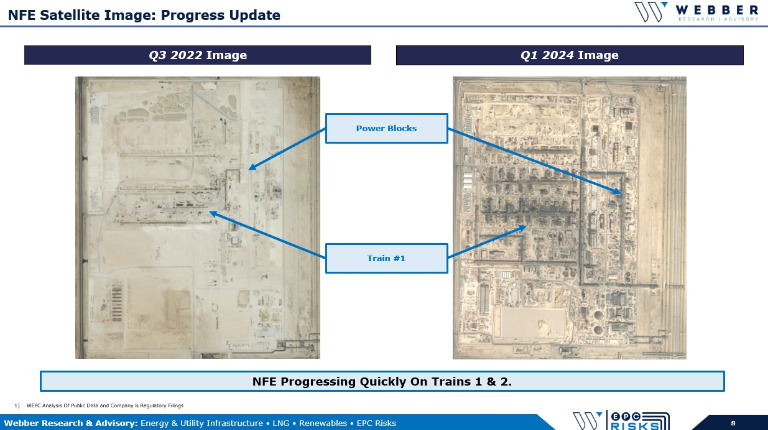
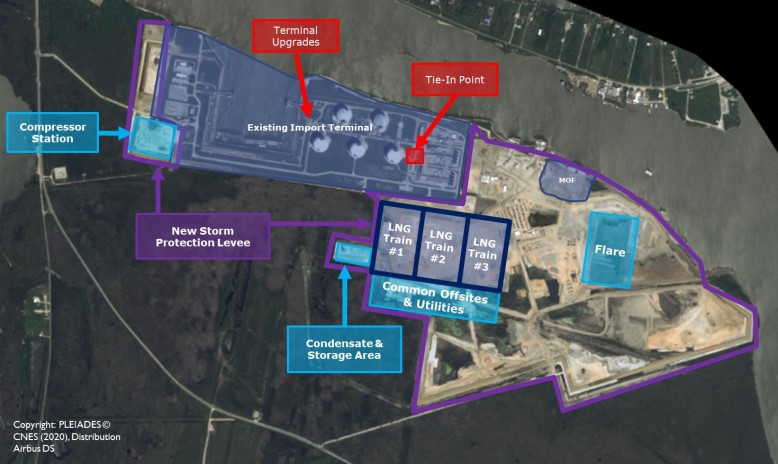
Golden Pass LNG Satellite Image Overview (page 13)